29
/
en
AIzaSyAYiBZKx7MnpbEhh9jyipgxe19OcubqV5w
April 1, 2024
38074
IDA blend
IDB
false
2
1
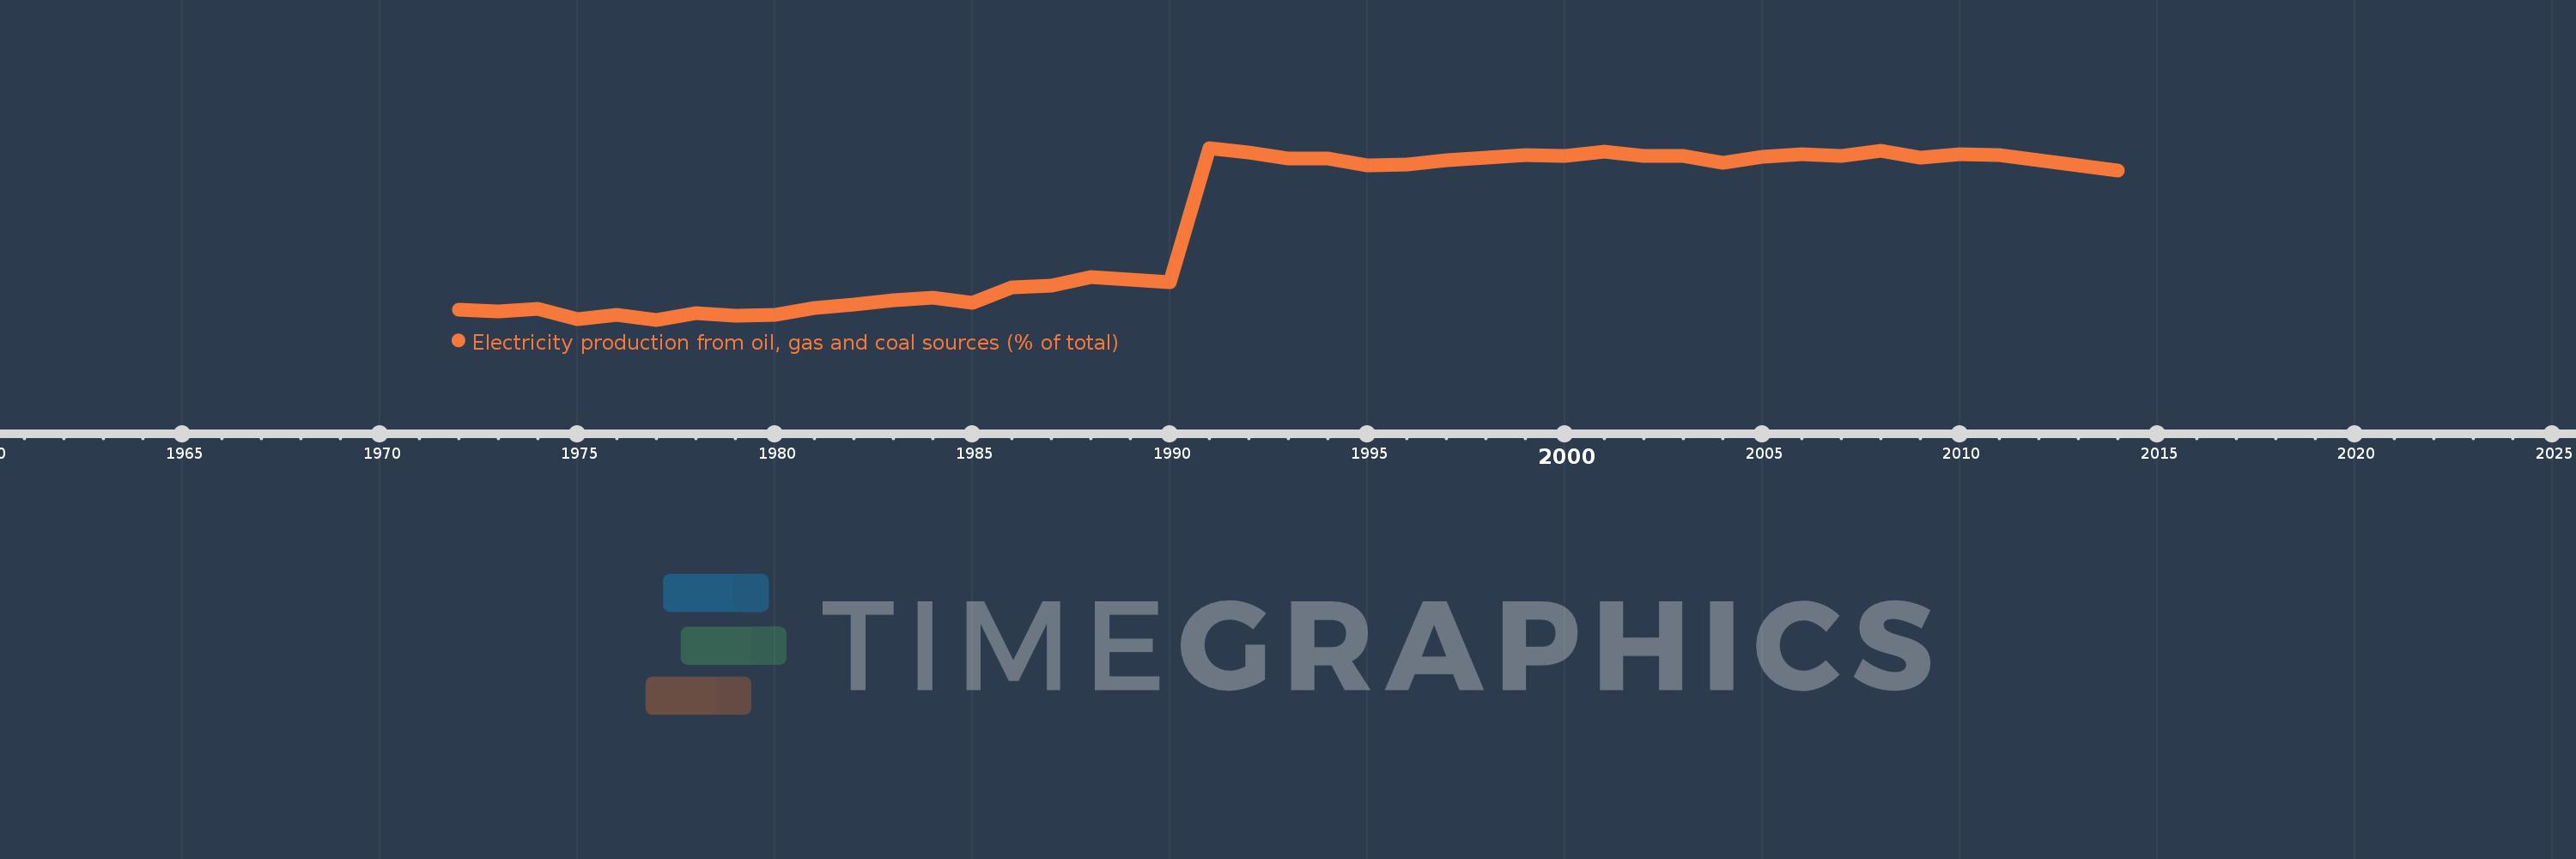
Electricity production from oil, gas and coal sources (% of total)
2014,2013,2012,2011,2010,2009,2008,2007,2006,2005,2004,2003,2002,2001,2000,1999,1998,1997,1996,1995,1994,1993,1992,1991,1990,1989,1988,1987,1986,1985,1984,1983,1982,1981,1980,1979,1978,1977,1976,1975,1974,1973,1972
This statistics in other country:
AlbaniaAlgeriaAngolaArab WorldArgentinaArmeniaAustraliaAustriaAzerbaijanBahrainBangladeshBelarusBelgiumBeninBoliviaBosnia and HerzegovinaBotswanaBrazilBrunei DarussalamBulgariaCambodiaCameroonCanadaCentral Europe and the BalticsChileChinaColombiaCongo, Dem. Rep.Congo, Rep.Costa RicaCote d'IvoireCroatiaCubaCuracaoCyprusCzech RepublicDenmarkDominican RepublicEarly-demographic dividendEast Asia & PacificEast Asia & Pacific (excluding high income)East Asia & Pacific (IDA & IBRD countries)EcuadorEgypt, Arab Rep.El SalvadorEritreaEstoniaEthiopiaEuro areaEurope & Central AsiaEurope & Central Asia (excluding high income)Europe & Central Asia (IDA & IBRD countries)European UnionFinlandFragile and conflict affected situationsFranceGabonGeorgiaGermanyGhanaGibraltarGreeceGuatemalaHaitiHeavily indebted poor countries (HIPC)High incomeHondurasHong Kong SAR, ChinaHungaryIBRD onlyIcelandIDA & IBRD totalIDA blendIDA onlyIDA totalIndiaIndonesiaIran, Islamic Rep.IraqIrelandIsraelItalyJamaicaJapanJordanKazakhstanKenyaKorea, Dem. People’s Rep.Korea, Rep.KosovoKuwaitKyrgyz RepublicLate-demographic dividendLatin America & Caribbean Latin America & Caribbean (excluding high income)Latin America & the Caribbean (IDA & IBRD countries)LatviaLeast developed countries: UN classificationLebanonLibyaLithuaniaLow & middle incomeLower middle incomeLuxembourgMacedonia, FYRMalaysiaMaltaMauritiusMexicoMiddle East & North AfricaMiddle East & North Africa (excluding high income)Middle East & North Africa (IDA & IBRD countries)Middle incomeMoldovaMongoliaMontenegroMoroccoMozambiqueMyanmarNamibiaNepalNetherlandsNew ZealandNicaraguaNigerNigeriaNorth AmericaNorwayOECD membersOmanOther small statesPakistanPanamaParaguayPeruPhilippinesPolandPortugalPost-demographic dividendPre-demographic dividendQatarRomaniaRussian FederationSaudi ArabiaSenegalSerbiaSingaporeSlovak RepublicSloveniaSmall statesSouth AfricaSouth AsiaSouth Asia (IDA & IBRD)South SudanSpainSri LankaSub-Saharan Africa Sub-Saharan Africa (excluding high income)Sub-Saharan Africa (IDA & IBRD countries)SudanSwedenSwitzerlandSyrian Arab RepublicTajikistanTanzaniaThailandTogoTrinidad and TobagoTunisiaTurkeyTurkmenistanUkraineUnited Arab EmiratesUnited KingdomUnited StatesUpper middle incomeUruguayUzbekistanVenezuela, RBVietnamWorldYemen, Rep.ZambiaZimbabwe Timeline:
This timeline shows a graph from 1972 to 2014 of IDA blend. No data until 1971. Number of actual observations by date: 43.
Source name:
World Development Indicators
Source organization:
IEA Statistics © OECD/IEA 2014 (http://www.iea.org/stats/index.asp), subject to https://www.iea.org/t&c/termsandconditions/
Categories, topics:
Energy & Mining, Environment
Last updated:
apr 23, 2017
Indicators value changes by year
Minimum:
15.944
jan 1, 1977
Maximum:
68.593
jan 1, 1991
At the date of observation
Value
Absolute change
Change from previous value
jan 1, 1972
19.103
+19.103
0.0%
jan 1, 1973
18.578
-0.525
-2.75%
jan 1, 1974
19.364
+0.786
4.23%
jan 1, 1975
16.141
-3.223
-16.64%
jan 1, 1976
17.358
+1.217
7.54%
jan 1, 1977
15.944
-1.414
-8.14%
jan 1, 1978
17.979
+2.035
12.76%
jan 1, 1979
17.236
-0.743
-4.13%
jan 1, 1980
17.561
+0.325
1.89%
jan 1, 1981
19.587
+2.026
11.54%
jan 1, 1982
20.68
+1.092
5.58%
jan 1, 1983
21.849
+1.169
5.66%
jan 1, 1984
22.608
+0.759
3.47%
jan 1, 1985
21.214
-1.394
-6.17%
jan 1, 1986
25.979
+4.765
22.46%
jan 1, 1987
26.345
+0.366
1.41%
jan 1, 1988
29.055
+2.711
10.29%
jan 1, 1989
28.168
-0.887
-3.05%
jan 1, 1990
27.375
-0.793
-2.82%
jan 1, 1991
68.593
+41.218
150.57%
jan 1, 1992
67.302
-1.291
-1.88%
jan 1, 1993
65.406
-1.896
-2.82%
jan 1, 1994
65.343
-0.064
-0.1%
jan 1, 1995
63.198
-2.145
-3.28%
jan 1, 1996
63.445
+0.247
0.39%
jan 1, 1997
64.851
+1.406
2.22%
jan 1, 1998
65.551
+0.699
1.08%
jan 1, 1999
66.36
+0.809
1.23%
jan 1, 2000
66.234
-0.126
-0.19%
jan 1, 2001
67.407
+1.173
1.77%
jan 1, 2002
66.137
-1.27
-1.88%
jan 1, 2003
66.091
-0.046
-0.07%
jan 1, 2004
63.99
-2.101
-3.18%
jan 1, 2005
65.924
+1.934
3.02%
jan 1, 2006
66.688
+0.764
1.16%
jan 1, 2007
66.017
-0.671
-1.01%
jan 1, 2008
67.633
+1.616
2.45%
jan 1, 2009
65.715
-1.918
-2.84%
jan 1, 2010
66.644
+0.929
1.41%
jan 1, 2011
66.467
-0.178
-0.27%
jan 1, 2012
64.93
-1.536
-2.31%
jan 1, 2013
63.185
-1.745
-2.69%
jan 1, 2014
61.62
-1.565
-2.48%
Ranking of countries by current statistics by years


Comments: