29
/
en
AIzaSyAYiBZKx7MnpbEhh9jyipgxe19OcubqV5w
April 1, 2024
39841
IDA total
IDA
false
2
1
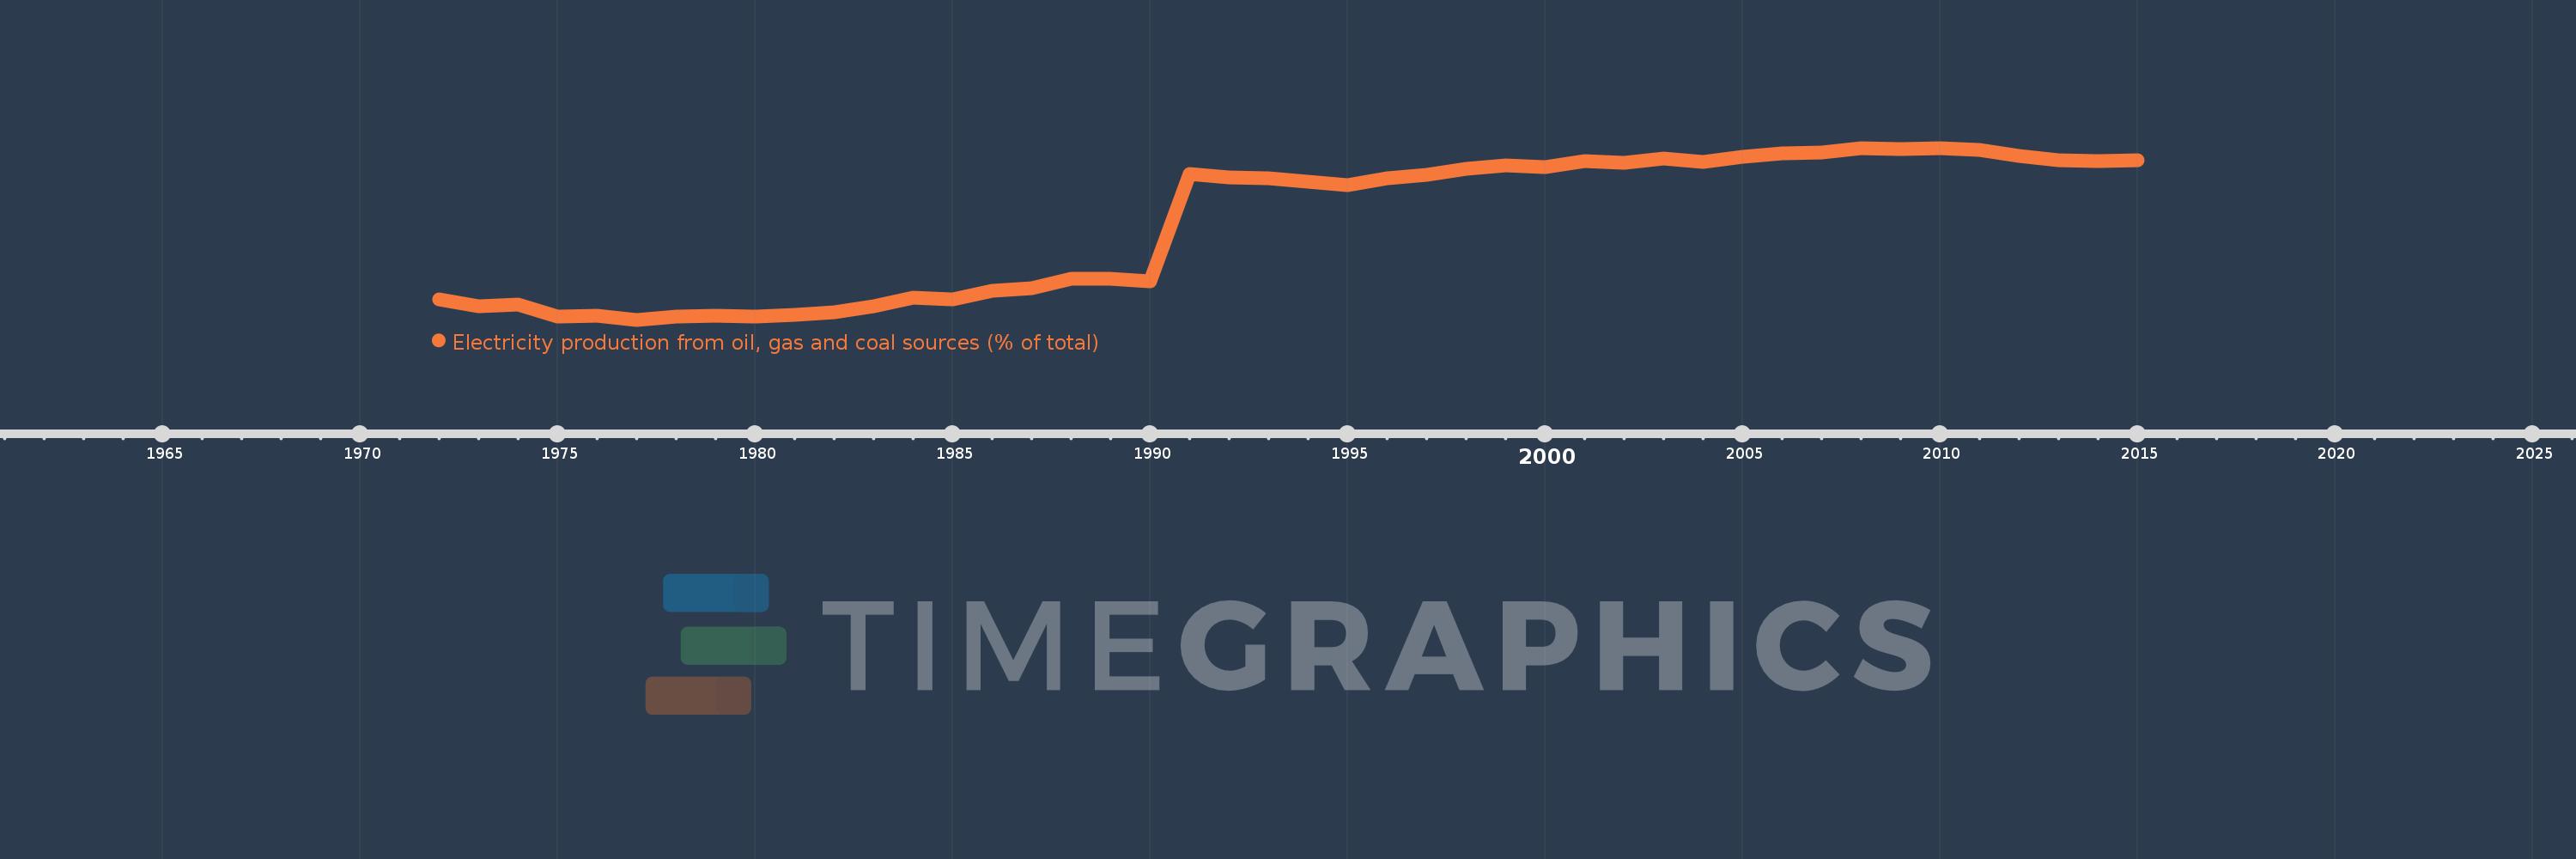
Electricity production from oil, gas and coal sources (% of total)
2015,2014,2013,2012,2011,2010,2009,2008,2007,2006,2005,2004,2003,2002,2001,2000,1999,1998,1997,1996,1995,1994,1993,1992,1991,1990,1989,1988,1987,1986,1985,1984,1983,1982,1981,1980,1979,1978,1977,1976,1975,1974,1973,1972
This statistics in other country:
AlbaniaAlgeriaAngolaArab WorldArgentinaArmeniaAustraliaAustriaAzerbaijanBahrainBangladeshBelarusBelgiumBeninBoliviaBosnia and HerzegovinaBotswanaBrazilBrunei DarussalamBulgariaCambodiaCameroonCanadaCentral Europe and the BalticsChileChinaColombiaCongo, Dem. Rep.Congo, Rep.Costa RicaCote d'IvoireCroatiaCubaCuracaoCyprusCzech RepublicDenmarkDominican RepublicEarly-demographic dividendEast Asia & PacificEast Asia & Pacific (excluding high income)East Asia & Pacific (IDA & IBRD countries)EcuadorEgypt, Arab Rep.El SalvadorEritreaEstoniaEthiopiaEuro areaEurope & Central AsiaEurope & Central Asia (excluding high income)Europe & Central Asia (IDA & IBRD countries)European UnionFinlandFragile and conflict affected situationsFranceGabonGeorgiaGermanyGhanaGibraltarGreeceGuatemalaHaitiHeavily indebted poor countries (HIPC)High incomeHondurasHong Kong SAR, ChinaHungaryIBRD onlyIcelandIDA & IBRD totalIDA blendIDA onlyIDA totalIndiaIndonesiaIran, Islamic Rep.IraqIrelandIsraelItalyJamaicaJapanJordanKazakhstanKenyaKorea, Dem. People’s Rep.Korea, Rep.KosovoKuwaitKyrgyz RepublicLate-demographic dividendLatin America & Caribbean Latin America & Caribbean (excluding high income)Latin America & the Caribbean (IDA & IBRD countries)LatviaLeast developed countries: UN classificationLebanonLibyaLithuaniaLow & middle incomeLower middle incomeLuxembourgMacedonia, FYRMalaysiaMaltaMauritiusMexicoMiddle East & North AfricaMiddle East & North Africa (excluding high income)Middle East & North Africa (IDA & IBRD countries)Middle incomeMoldovaMongoliaMontenegroMoroccoMozambiqueMyanmarNamibiaNepalNetherlandsNew ZealandNicaraguaNigerNigeriaNorth AmericaNorwayOECD membersOmanOther small statesPakistanPanamaParaguayPeruPhilippinesPolandPortugalPost-demographic dividendPre-demographic dividendQatarRomaniaRussian FederationSaudi ArabiaSenegalSerbiaSingaporeSlovak RepublicSloveniaSmall statesSouth AfricaSouth AsiaSouth Asia (IDA & IBRD)South SudanSpainSri LankaSub-Saharan Africa Sub-Saharan Africa (excluding high income)Sub-Saharan Africa (IDA & IBRD countries)SudanSwedenSwitzerlandSyrian Arab RepublicTajikistanTanzaniaThailandTogoTrinidad and TobagoTunisiaTurkeyTurkmenistanUkraineUnited Arab EmiratesUnited KingdomUnited StatesUpper middle incomeUruguayUzbekistanVenezuela, RBVietnamWorldYemen, Rep.ZambiaZimbabwe Timeline:
This timeline shows a graph from 1972 to 2015 of IDA total. No data until 1971. Number of actual observations by date: 44.
Source name:
World Development Indicators
Source organization:
IEA Statistics © OECD/IEA 2014 (http://www.iea.org/stats/index.asp), subject to https://www.iea.org/t&c/termsandconditions/
Categories, topics:
Energy & Mining, Environment
Last updated:
apr 23, 2017
Indicators value changes by year
Minimum:
13.581
jan 1, 1977
Maximum:
56.107
jan 1, 2010
At the date of observation
Value
Absolute change
Change from previous value
jan 1, 1972
18.657
+18.657
0.0%
jan 1, 1973
16.941
-1.717
-9.2%
jan 1, 1974
17.331
+0.391
2.31%
jan 1, 1975
14.316
-3.016
-17.4%
jan 1, 1976
14.652
+0.337
2.35%
jan 1, 1977
13.581
-1.071
-7.31%
jan 1, 1978
14.305
+0.724
5.33%
jan 1, 1979
14.484
+0.179
1.25%
jan 1, 1980
14.372
-0.112
-0.77%
jan 1, 1981
14.85
+0.478
3.33%
jan 1, 1982
15.515
+0.665
4.47%
jan 1, 1983
16.882
+1.367
8.81%
jan 1, 1984
18.989
+2.107
12.48%
jan 1, 1985
18.647
-0.342
-1.8%
jan 1, 1986
20.723
+2.076
11.13%
jan 1, 1987
21.415
+0.693
3.34%
jan 1, 1988
23.679
+2.264
10.57%
jan 1, 1989
23.738
+0.059
0.25%
jan 1, 1990
23.127
-0.611
-2.58%
jan 1, 1991
49.584
+26.458
114.4%
jan 1, 1992
48.774
-0.811
-1.63%
jan 1, 1993
48.498
-0.275
-0.56%
jan 1, 1994
47.763
-0.736
-1.52%
jan 1, 1995
46.865
-0.898
-1.88%
jan 1, 1996
48.575
+1.71
3.65%
jan 1, 1997
49.387
+0.812
1.67%
jan 1, 1998
50.971
+1.584
3.21%
jan 1, 1999
51.893
+0.922
1.81%
jan 1, 2000
51.321
-0.572
-1.1%
jan 1, 2001
52.88
+1.559
3.04%
jan 1, 2002
52.44
-0.44
-0.83%
jan 1, 2003
53.438
+0.998
1.9%
jan 1, 2004
52.576
-0.863
-1.61%
jan 1, 2005
53.992
+1.416
2.69%
jan 1, 2006
54.687
+0.695
1.29%
jan 1, 2007
54.925
+0.238
0.43%
jan 1, 2008
55.992
+1.067
1.94%
jan 1, 2009
55.796
-0.196
-0.35%
jan 1, 2010
56.107
+0.312
0.56%
jan 1, 2011
55.711
-0.396
-0.71%
jan 1, 2012
54.059
-1.652
-2.96%
jan 1, 2013
52.97
-1.089
-2.01%
jan 1, 2014
52.819
-0.151
-0.29%
jan 1, 2015
52.967
+0.149
0.28%
Ranking of countries by current statistics by years


Comments: