29
/
en
AIzaSyAYiBZKx7MnpbEhh9jyipgxe19OcubqV5w
April 1, 2024
241486
Slovak Republic
SVK
true
2
1
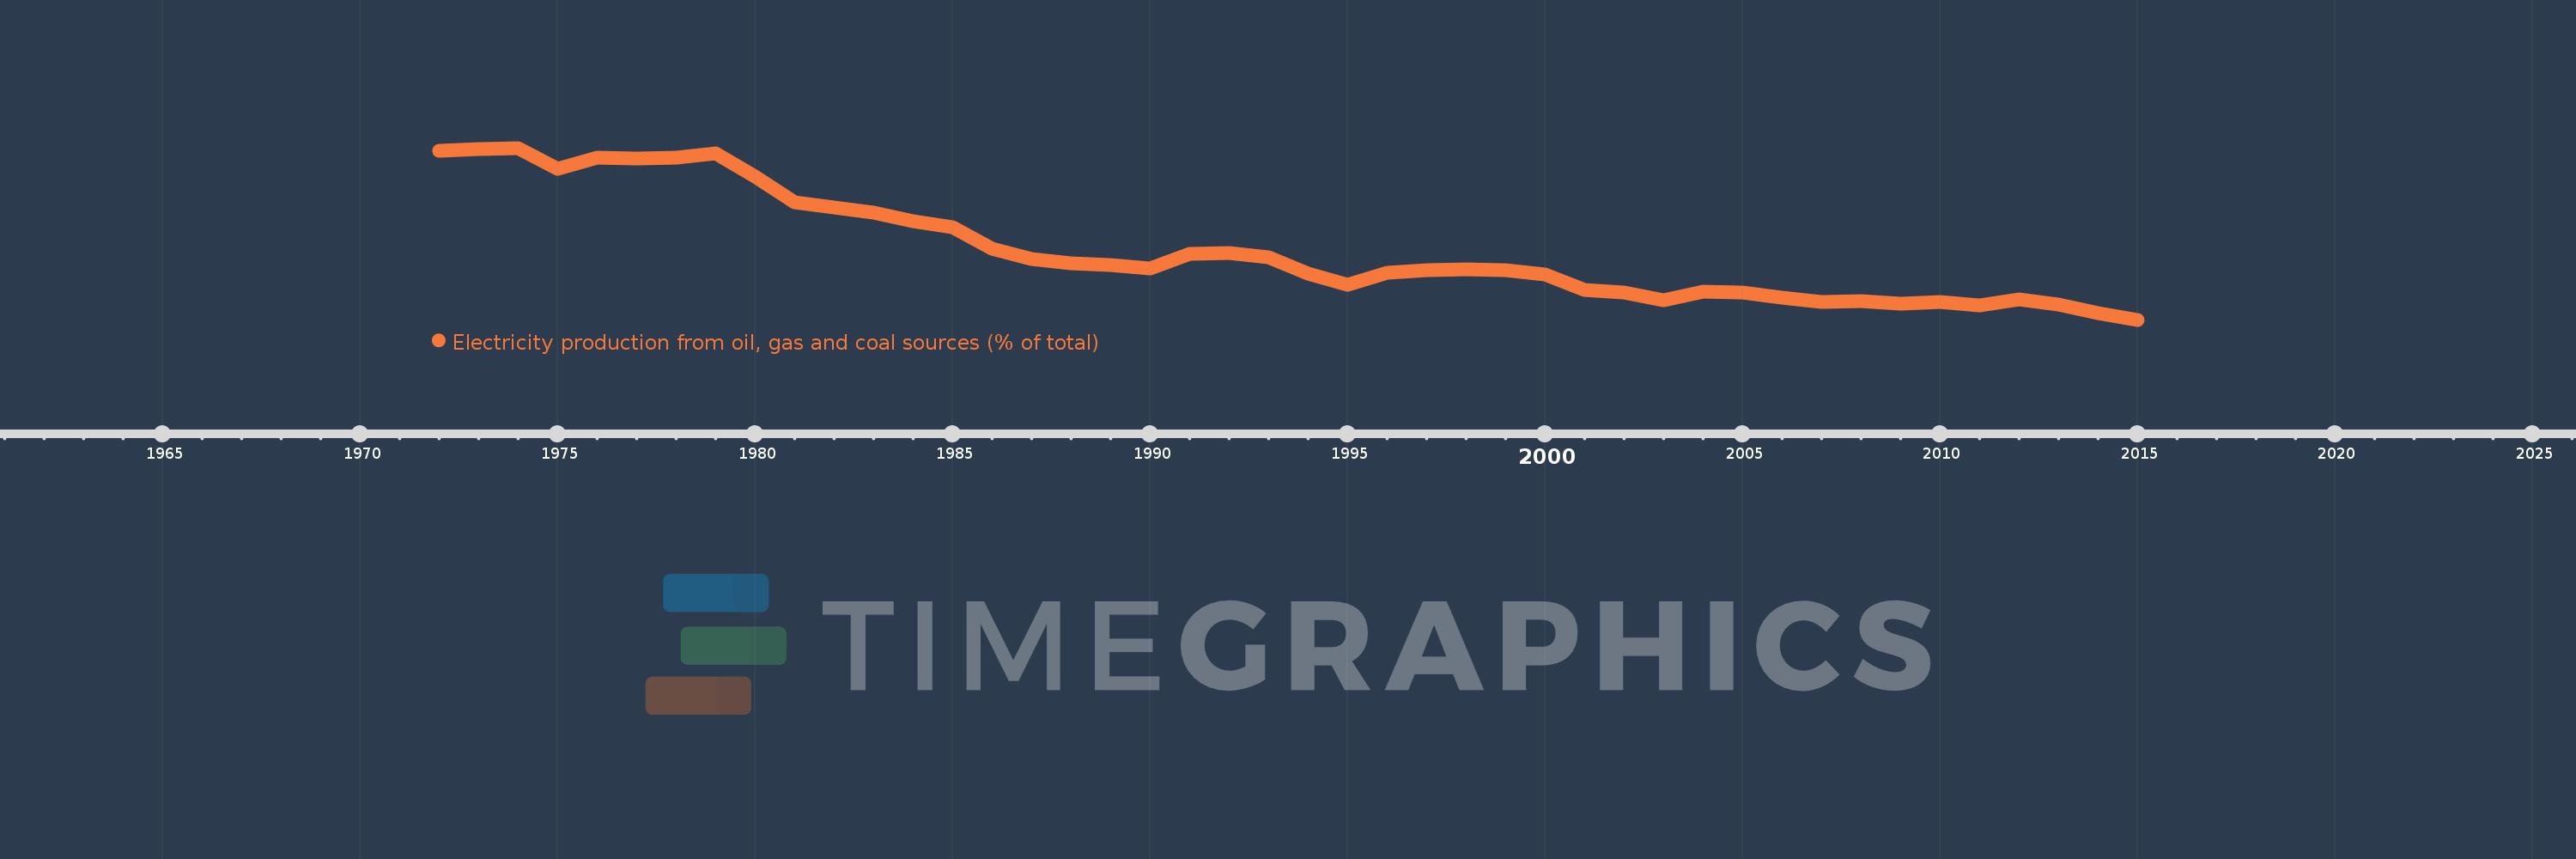
Electricity production from oil, gas and coal sources (% of total)
2015,2014,2013,2012,2011,2010,2009,2008,2007,2006,2005,2004,2003,2002,2001,2000,1999,1998,1997,1996,1995,1994,1993,1992,1991,1990,1989,1988,1987,1986,1985,1984,1983,1982,1981,1980,1979,1978,1977,1976,1975,1974,1973,1972
This statistics in other country:
AlbaniaAlgeriaAngolaArab WorldArgentinaArmeniaAustraliaAustriaAzerbaijanBahrainBangladeshBelarusBelgiumBeninBoliviaBosnia and HerzegovinaBotswanaBrazilBrunei DarussalamBulgariaCambodiaCameroonCanadaCentral Europe and the BalticsChileChinaColombiaCongo, Dem. Rep.Congo, Rep.Costa RicaCote d'IvoireCroatiaCubaCuracaoCyprusCzech RepublicDenmarkDominican RepublicEarly-demographic dividendEast Asia & PacificEast Asia & Pacific (excluding high income)East Asia & Pacific (IDA & IBRD countries)EcuadorEgypt, Arab Rep.El SalvadorEritreaEstoniaEthiopiaEuro areaEurope & Central AsiaEurope & Central Asia (excluding high income)Europe & Central Asia (IDA & IBRD countries)European UnionFinlandFragile and conflict affected situationsFranceGabonGeorgiaGermanyGhanaGibraltarGreeceGuatemalaHaitiHeavily indebted poor countries (HIPC)High incomeHondurasHong Kong SAR, ChinaHungaryIBRD onlyIcelandIDA & IBRD totalIDA blendIDA onlyIDA totalIndiaIndonesiaIran, Islamic Rep.IraqIrelandIsraelItalyJamaicaJapanJordanKazakhstanKenyaKorea, Dem. People’s Rep.Korea, Rep.KosovoKuwaitKyrgyz RepublicLate-demographic dividendLatin America & Caribbean Latin America & Caribbean (excluding high income)Latin America & the Caribbean (IDA & IBRD countries)LatviaLeast developed countries: UN classificationLebanonLibyaLithuaniaLow & middle incomeLower middle incomeLuxembourgMacedonia, FYRMalaysiaMaltaMauritiusMexicoMiddle East & North AfricaMiddle East & North Africa (excluding high income)Middle East & North Africa (IDA & IBRD countries)Middle incomeMoldovaMongoliaMontenegroMoroccoMozambiqueMyanmarNamibiaNepalNetherlandsNew ZealandNicaraguaNigerNigeriaNorth AmericaNorwayOECD membersOmanOther small statesPakistanPanamaParaguayPeruPhilippinesPolandPortugalPost-demographic dividendPre-demographic dividendQatarRomaniaRussian FederationSaudi ArabiaSenegalSerbiaSingaporeSlovak RepublicSloveniaSmall statesSouth AfricaSouth AsiaSouth Asia (IDA & IBRD)South SudanSpainSri LankaSub-Saharan Africa Sub-Saharan Africa (excluding high income)Sub-Saharan Africa (IDA & IBRD countries)SudanSwedenSwitzerlandSyrian Arab RepublicTajikistanTanzaniaThailandTogoTrinidad and TobagoTunisiaTurkeyTurkmenistanUkraineUnited Arab EmiratesUnited KingdomUnited StatesUpper middle incomeUruguayUzbekistanVenezuela, RBVietnamWorldYemen, Rep.ZambiaZimbabwe Timeline:
This timeline shows a graph from 1972 to 2015 of Slovak Republic. No data until 1971. Number of actual observations by date: 44.
Source name:
World Development Indicators
Source organization:
IEA Statistics © OECD/IEA 2014 (http://www.iea.org/stats/index.asp), subject to https://www.iea.org/t&c/termsandconditions/
Categories, topics:
Energy & Mining, Environment
Last updated:
apr 23, 2017
Indicators value changes by year
Minimum:
19.578
jan 1, 2015
Maximum:
87.365
jan 1, 1974
At the date of observation
Value
Absolute change
Change from previous value
jan 1, 1972
86.415
+86.415
0.0%
jan 1, 1973
86.898
+0.483
0.56%
jan 1, 1974
87.365
+0.466
0.54%
jan 1, 1975
78.977
-8.388
-9.6%
jan 1, 1976
83.626
+4.649
5.89%
jan 1, 1977
83.047
-0.579
-0.69%
jan 1, 1978
83.524
+0.476
0.57%
jan 1, 1979
85.238
+1.715
2.05%
jan 1, 1980
76.067
-9.171
-10.76%
jan 1, 1981
66.044
-10.023
-13.18%
jan 1, 1982
63.974
-2.07
-3.13%
jan 1, 1983
61.691
-2.282
-3.57%
jan 1, 1984
58.496
-3.195
-5.18%
jan 1, 1985
55.913
-2.583
-4.42%
jan 1, 1986
47.601
-8.312
-14.87%
jan 1, 1987
43.567
-4.034
-8.47%
jan 1, 1988
41.852
-1.715
-3.94%
jan 1, 1989
41.184
-0.668
-1.6%
jan 1, 1990
39.662
-1.521
-3.69%
jan 1, 1991
45.421
+5.759
14.52%
jan 1, 1992
46.016
+0.595
1.31%
jan 1, 1993
44.099
-1.918
-4.17%
jan 1, 1994
37.802
-6.297
-14.28%
jan 1, 1995
33.42
-4.382
-11.59%
jan 1, 1996
38.259
+4.839
14.48%
jan 1, 1997
39.2
+0.941
2.46%
jan 1, 1998
39.568
+0.368
0.94%
jan 1, 1999
39.091
-0.477
-1.2%
jan 1, 2000
37.299
-1.792
-4.58%
jan 1, 2001
31.356
-5.943
-15.93%
jan 1, 2002
30.28
-1.076
-3.43%
jan 1, 2003
27.359
-2.921
-9.65%
jan 1, 2004
30.682
+3.322
12.14%
jan 1, 2005
30.443
-0.238
-0.78%
jan 1, 2006
28.403
-2.04
-6.7%
jan 1, 2007
26.754
-1.649
-5.81%
jan 1, 2008
27.069
+0.314
1.17%
jan 1, 2009
25.859
-1.21
-4.47%
jan 1, 2010
26.513
+0.655
2.53%
jan 1, 2011
25.073
-1.441
-5.43%
jan 1, 2012
27.482
+2.409
9.61%
jan 1, 2013
25.646
-1.836
-6.68%
jan 1, 2014
22.263
-3.383
-13.19%
jan 1, 2015
19.578
-2.685
-12.06%
Ranking of countries by current statistics by years


Comments: