29
/
en
AIzaSyAYiBZKx7MnpbEhh9jyipgxe19OcubqV5w
April 1, 2024
99804
Cameroon
CMR
true
2
1
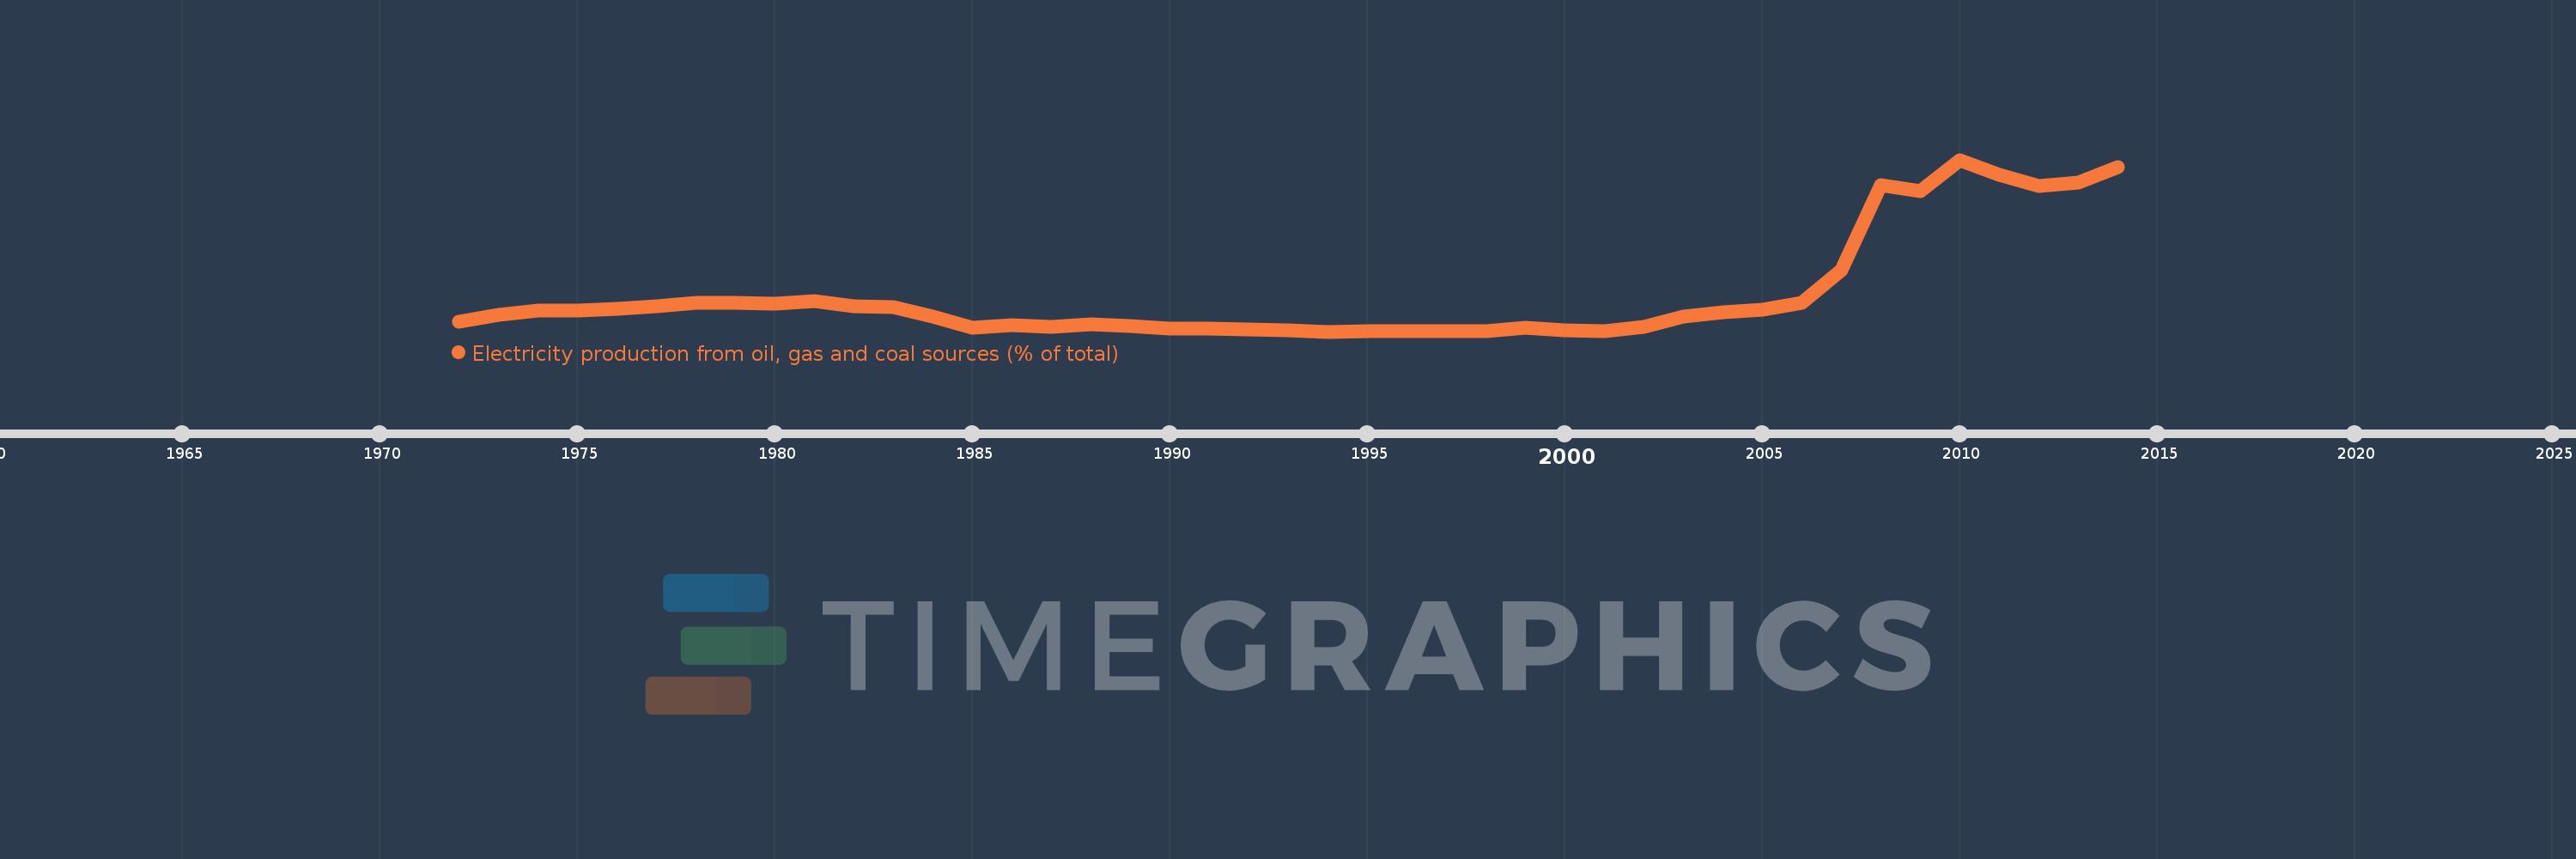
Electricity production from oil, gas and coal sources (% of total)
2014,2013,2012,2011,2010,2009,2008,2007,2006,2005,2004,2003,2002,2001,2000,1999,1998,1997,1996,1995,1994,1993,1992,1991,1990,1989,1988,1987,1986,1985,1984,1983,1982,1981,1980,1979,1978,1977,1976,1975,1974,1973,1972
This statistics in other country:
AlbaniaAlgeriaAngolaArab WorldArgentinaArmeniaAustraliaAustriaAzerbaijanBahrainBangladeshBelarusBelgiumBeninBoliviaBosnia and HerzegovinaBotswanaBrazilBrunei DarussalamBulgariaCambodiaCameroonCanadaCentral Europe and the BalticsChileChinaColombiaCongo, Dem. Rep.Congo, Rep.Costa RicaCote d'IvoireCroatiaCubaCuracaoCyprusCzech RepublicDenmarkDominican RepublicEarly-demographic dividendEast Asia & PacificEast Asia & Pacific (excluding high income)East Asia & Pacific (IDA & IBRD countries)EcuadorEgypt, Arab Rep.El SalvadorEritreaEstoniaEthiopiaEuro areaEurope & Central AsiaEurope & Central Asia (excluding high income)Europe & Central Asia (IDA & IBRD countries)European UnionFinlandFragile and conflict affected situationsFranceGabonGeorgiaGermanyGhanaGibraltarGreeceGuatemalaHaitiHeavily indebted poor countries (HIPC)High incomeHondurasHong Kong SAR, ChinaHungaryIBRD onlyIcelandIDA & IBRD totalIDA blendIDA onlyIDA totalIndiaIndonesiaIran, Islamic Rep.IraqIrelandIsraelItalyJamaicaJapanJordanKazakhstanKenyaKorea, Dem. People’s Rep.Korea, Rep.KosovoKuwaitKyrgyz RepublicLate-demographic dividendLatin America & Caribbean Latin America & Caribbean (excluding high income)Latin America & the Caribbean (IDA & IBRD countries)LatviaLeast developed countries: UN classificationLebanonLibyaLithuaniaLow & middle incomeLower middle incomeLuxembourgMacedonia, FYRMalaysiaMaltaMauritiusMexicoMiddle East & North AfricaMiddle East & North Africa (excluding high income)Middle East & North Africa (IDA & IBRD countries)Middle incomeMoldovaMongoliaMontenegroMoroccoMozambiqueMyanmarNamibiaNepalNetherlandsNew ZealandNicaraguaNigerNigeriaNorth AmericaNorwayOECD membersOmanOther small statesPakistanPanamaParaguayPeruPhilippinesPolandPortugalPost-demographic dividendPre-demographic dividendQatarRomaniaRussian FederationSaudi ArabiaSenegalSerbiaSingaporeSlovak RepublicSloveniaSmall statesSouth AfricaSouth AsiaSouth Asia (IDA & IBRD)South SudanSpainSri LankaSub-Saharan Africa Sub-Saharan Africa (excluding high income)Sub-Saharan Africa (IDA & IBRD countries)SudanSwedenSwitzerlandSyrian Arab RepublicTajikistanTanzaniaThailandTogoTrinidad and TobagoTunisiaTurkeyTurkmenistanUkraineUnited Arab EmiratesUnited KingdomUnited StatesUpper middle incomeUruguayUzbekistanVenezuela, RBVietnamWorldYemen, Rep.ZambiaZimbabwe Timeline:
This timeline shows a graph from 1972 to 2014 of Cameroon. No data until 1971. Number of actual observations by date: 43.
Source name:
World Development Indicators
Source organization:
IEA Statistics © OECD/IEA 2014 (http://www.iea.org/stats/index.asp), subject to https://www.iea.org/t&c/termsandconditions/
Categories, topics:
Energy & Mining, Environment
Last updated:
apr 23, 2017
Indicators value changes by year
Maximum:
29.327
jan 1, 2010
At the date of observation
Value
Absolute change
Change from previous value
jan 1, 1972
2.698
+2.698
0.0%
jan 1, 1973
3.767
+1.069
39.63%
jan 1, 1974
4.472
+0.705
18.73%
jan 1, 1975
4.571
+0.099
2.21%
jan 1, 1976
4.779
+0.208
4.56%
jan 1, 1977
5.279
+0.5
10.45%
jan 1, 1978
5.769
+0.49
9.29%
jan 1, 1979
5.834
+0.065
1.12%
jan 1, 1980
5.696
-0.138
-2.37%
jan 1, 1981
6.056
+0.361
6.33%
jan 1, 1982
5.186
-0.87
-14.37%
jan 1, 1983
5.121
-0.065
-1.25%
jan 1, 1984
3.466
-1.655
-32.32%
jan 1, 1985
1.715
-1.751
-50.52%
jan 1, 1986
2.171
+0.456
26.62%
jan 1, 1987
1.897
-0.275
-12.64%
jan 1, 1988
2.273
+0.376
19.83%
jan 1, 1989
1.944
-0.328
-14.45%
jan 1, 1990
1.588
-0.356
-18.3%
jan 1, 1991
1.52
-0.068
-4.3%
jan 1, 1992
1.439
-0.081
-5.33%
jan 1, 1993
1.279
-0.16
-11.14%
jan 1, 1994
1.059
-0.219
-17.16%
jan 1, 1995
1.176
+0.117
11.06%
jan 1, 1996
1.149
-0.027
-2.33%
jan 1, 1997
1.138
-0.011
-1.0%
jan 1, 1998
1.151
+0.013
1.17%
jan 1, 1999
1.641
+0.491
42.62%
jan 1, 2000
1.244
-0.397
-24.21%
jan 1, 2001
1.092
-0.152
-12.23%
jan 1, 2002
1.892
+0.8
73.28%
jan 1, 2003
3.576
+1.684
88.98%
jan 1, 2004
4.235
+0.659
18.42%
jan 1, 2005
4.623
+0.388
9.17%
jan 1, 2006
5.794
+1.171
25.34%
jan 1, 2007
11.183
+5.389
93.0%
jan 1, 2008
25.176
+13.994
125.13%
jan 1, 2009
24.151
-1.026
-4.07%
jan 1, 2010
29.327
+5.177
21.43%
jan 1, 2011
26.784
-2.543
-8.67%
jan 1, 2012
24.987
-1.797
-6.71%
jan 1, 2013
25.547
+0.559
2.24%
jan 1, 2014
28.121
+2.574
10.08%
Ranking of countries by current statistics by years


Comments: