29
/
en
AIzaSyAYiBZKx7MnpbEhh9jyipgxe19OcubqV5w
April 1, 2024
164717
Jordan
JOR
true
2
1
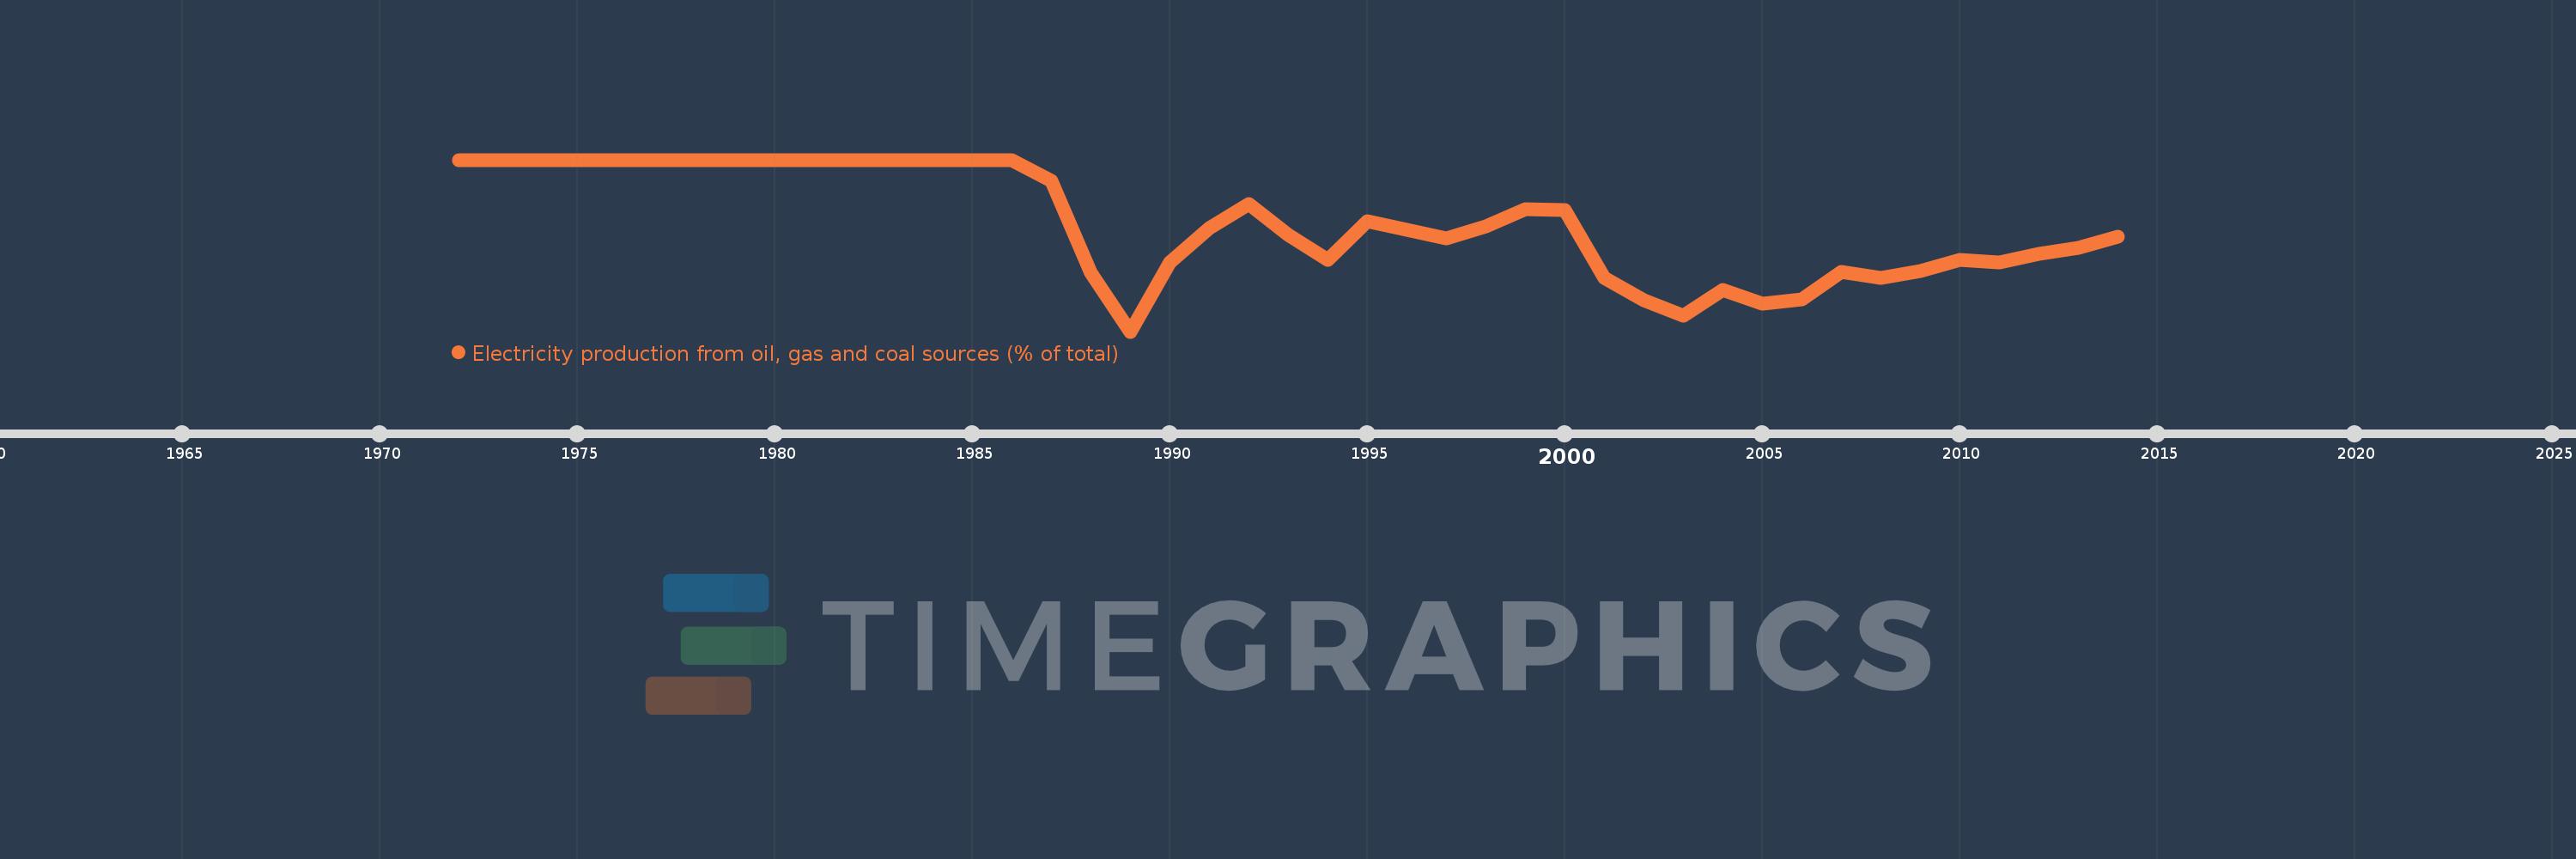
Electricity production from oil, gas and coal sources (% of total)
2014,2013,2012,2011,2010,2009,2008,2007,2006,2005,2004,2003,2002,2001,2000,1999,1998,1997,1996,1995,1994,1993,1992,1991,1990,1989,1988,1987,1986,1985,1984,1983,1982,1981,1980,1979,1978,1977,1976,1975,1974,1973,1972
This statistics in other country:
AlbaniaAlgeriaAngolaArab WorldArgentinaArmeniaAustraliaAustriaAzerbaijanBahrainBangladeshBelarusBelgiumBeninBoliviaBosnia and HerzegovinaBotswanaBrazilBrunei DarussalamBulgariaCambodiaCameroonCanadaCentral Europe and the BalticsChileChinaColombiaCongo, Dem. Rep.Congo, Rep.Costa RicaCote d'IvoireCroatiaCubaCuracaoCyprusCzech RepublicDenmarkDominican RepublicEarly-demographic dividendEast Asia & PacificEast Asia & Pacific (excluding high income)East Asia & Pacific (IDA & IBRD countries)EcuadorEgypt, Arab Rep.El SalvadorEritreaEstoniaEthiopiaEuro areaEurope & Central AsiaEurope & Central Asia (excluding high income)Europe & Central Asia (IDA & IBRD countries)European UnionFinlandFragile and conflict affected situationsFranceGabonGeorgiaGermanyGhanaGibraltarGreeceGuatemalaHaitiHeavily indebted poor countries (HIPC)High incomeHondurasHong Kong SAR, ChinaHungaryIBRD onlyIcelandIDA & IBRD totalIDA blendIDA onlyIDA totalIndiaIndonesiaIran, Islamic Rep.IraqIrelandIsraelItalyJamaicaJapanJordanKazakhstanKenyaKorea, Dem. People’s Rep.Korea, Rep.KosovoKuwaitKyrgyz RepublicLate-demographic dividendLatin America & Caribbean Latin America & Caribbean (excluding high income)Latin America & the Caribbean (IDA & IBRD countries)LatviaLeast developed countries: UN classificationLebanonLibyaLithuaniaLow & middle incomeLower middle incomeLuxembourgMacedonia, FYRMalaysiaMaltaMauritiusMexicoMiddle East & North AfricaMiddle East & North Africa (excluding high income)Middle East & North Africa (IDA & IBRD countries)Middle incomeMoldovaMongoliaMontenegroMoroccoMozambiqueMyanmarNamibiaNepalNetherlandsNew ZealandNicaraguaNigerNigeriaNorth AmericaNorwayOECD membersOmanOther small statesPakistanPanamaParaguayPeruPhilippinesPolandPortugalPost-demographic dividendPre-demographic dividendQatarRomaniaRussian FederationSaudi ArabiaSenegalSerbiaSingaporeSlovak RepublicSloveniaSmall statesSouth AfricaSouth AsiaSouth Asia (IDA & IBRD)South SudanSpainSri LankaSub-Saharan Africa Sub-Saharan Africa (excluding high income)Sub-Saharan Africa (IDA & IBRD countries)SudanSwedenSwitzerlandSyrian Arab RepublicTajikistanTanzaniaThailandTogoTrinidad and TobagoTunisiaTurkeyTurkmenistanUkraineUnited Arab EmiratesUnited KingdomUnited StatesUpper middle incomeUruguayUzbekistanVenezuela, RBVietnamWorldYemen, Rep.ZambiaZimbabwe Timeline:
This timeline shows a graph from 1972 to 2014 of Jordan. No data until 1971. Number of actual observations by date: 43.
Source name:
World Development Indicators
Source organization:
IEA Statistics © OECD/IEA 2014 (http://www.iea.org/stats/index.asp), subject to https://www.iea.org/t&c/termsandconditions/
Categories, topics:
Energy & Mining, Environment
Last updated:
apr 23, 2017
Indicators value changes by year
Minimum:
99.173
jan 1, 1989
At the date of observation
Value
Absolute change
Change from previous value
jan 1, 1972
100.0
+100.0
0.0%
jan 1, 1973
100.0
0.0
0.0%
jan 1, 1974
100.0
0.0
0.0%
jan 1, 1975
100.0
0.0
0.0%
jan 1, 1976
100.0
0.0
0.0%
jan 1, 1977
100.0
0.0
0.0%
jan 1, 1978
100.0
0.0
0.0%
jan 1, 1979
100.0
0.0
0.0%
jan 1, 1980
100.0
0.0
0.0%
jan 1, 1981
100.0
0.0
0.0%
jan 1, 1982
100.0
0.0
0.0%
jan 1, 1983
100.0
0.0
0.0%
jan 1, 1984
100.0
0.0
0.0%
jan 1, 1985
100.0
0.0
0.0%
jan 1, 1986
100.0
0.0
0.0%
jan 1, 1987
99.898
-0.102
-0.1%
jan 1, 1988
99.455
-0.444
-0.44%
jan 1, 1989
99.173
-0.282
-0.28%
jan 1, 1990
99.505
+0.332
0.34%
jan 1, 1991
99.67
+0.165
0.17%
jan 1, 1992
99.785
+0.115
0.12%
jan 1, 1993
99.638
-0.147
-0.15%
jan 1, 1994
99.517
-0.121
-0.12%
jan 1, 1995
99.704
+0.188
0.19%
jan 1, 1996
99.662
-0.043
-0.04%
jan 1, 1997
99.62
-0.041
-0.04%
jan 1, 1998
99.681
+0.06
0.06%
jan 1, 1999
99.763
+0.082
0.08%
jan 1, 2000
99.76
-0.003
0.0%
jan 1, 2001
99.431
-0.329
-0.33%
jan 1, 2002
99.324
-0.106
-0.11%
jan 1, 2003
99.25
-0.075
-0.08%
jan 1, 2004
99.375
+0.125
0.13%
jan 1, 2005
99.309
-0.066
-0.07%
jan 1, 2006
99.327
+0.018
0.02%
jan 1, 2007
99.46
+0.134
0.13%
jan 1, 2008
99.431
-0.03
-0.03%
jan 1, 2009
99.465
+0.034
0.03%
jan 1, 2010
99.517
+0.051
0.05%
jan 1, 2011
99.506
-0.011
-0.01%
jan 1, 2012
99.549
+0.043
0.04%
jan 1, 2013
99.578
+0.029
0.03%
jan 1, 2014
99.629
+0.051
0.05%
Ranking of countries by current statistics by years


Comments: