29
/
en
AIzaSyAYiBZKx7MnpbEhh9jyipgxe19OcubqV5w
April 1, 2024
40627
Late-demographic dividend
LTE
false
2
1
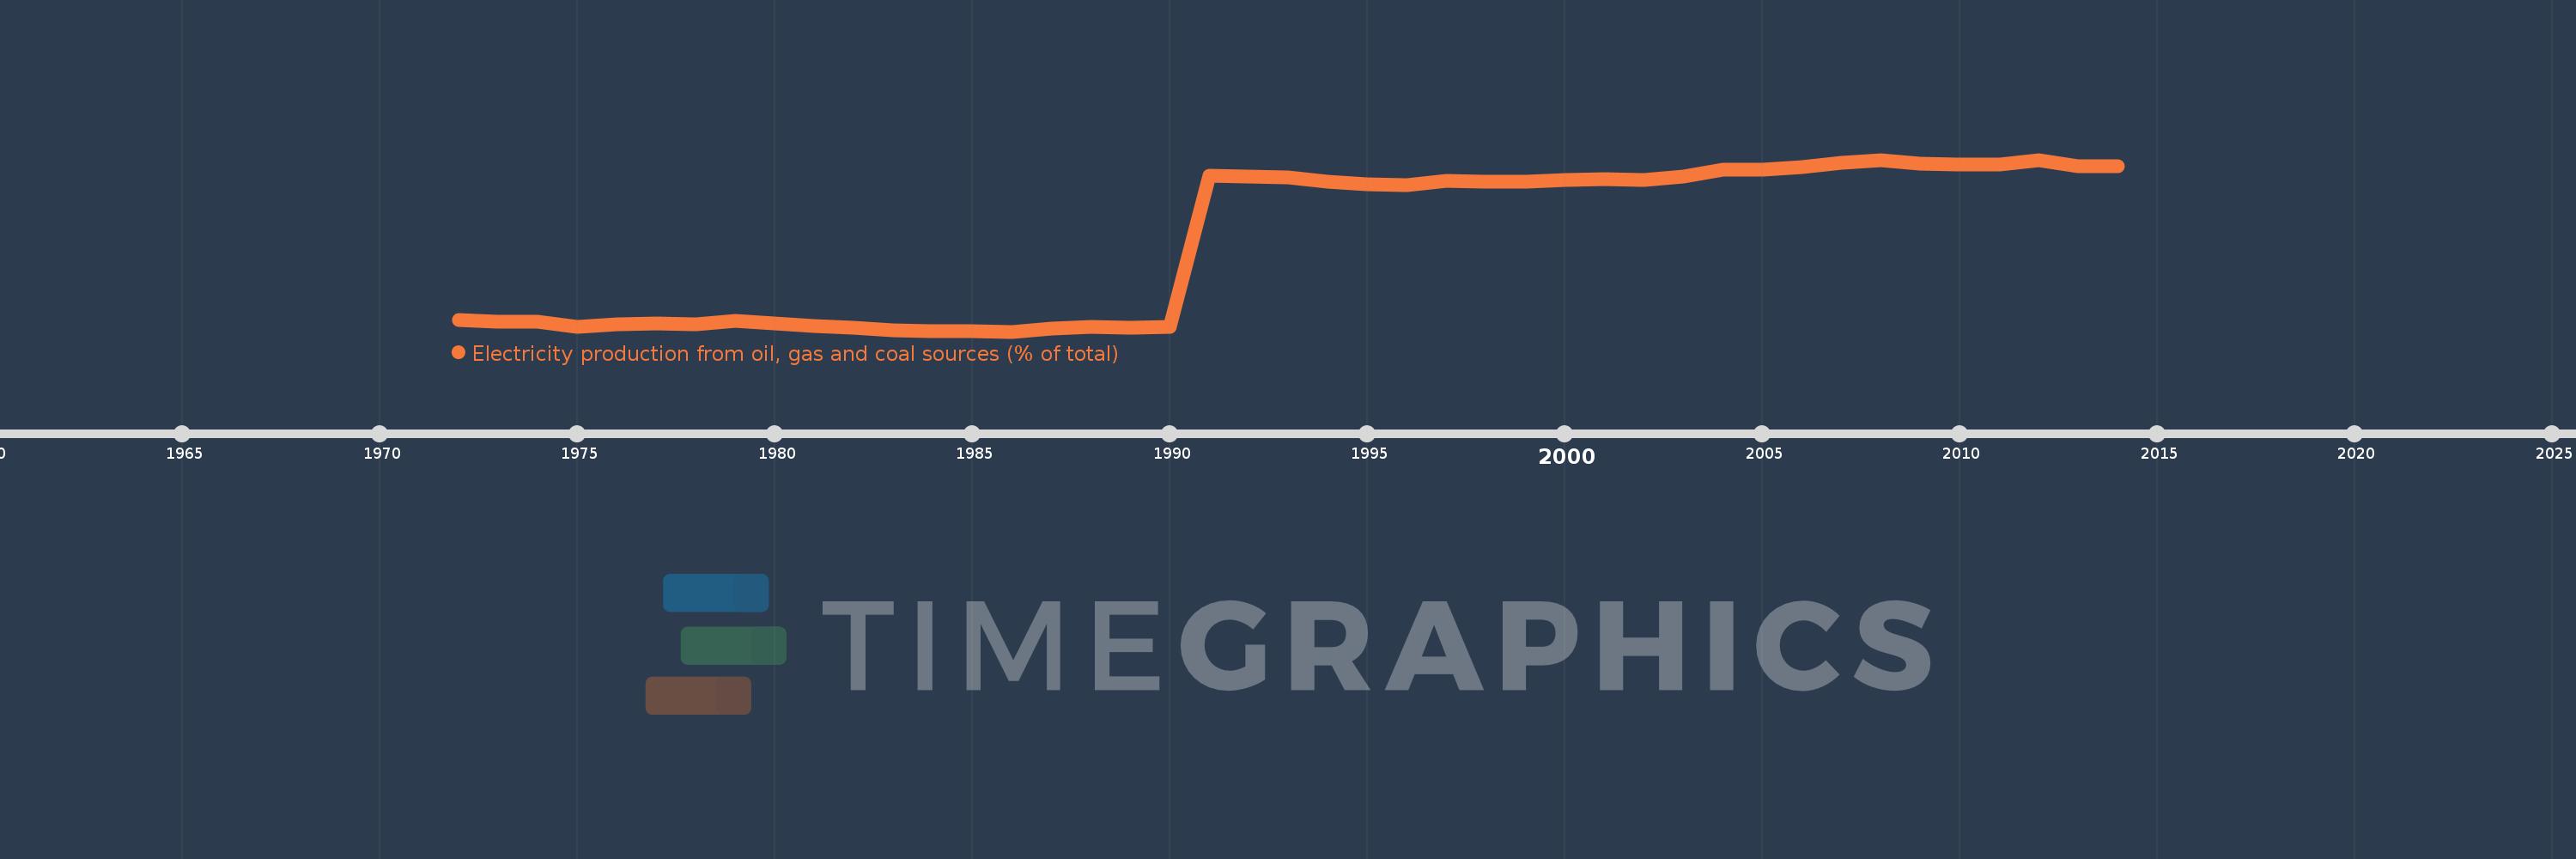
Electricity production from oil, gas and coal sources (% of total)
2014,2013,2012,2011,2010,2009,2008,2007,2006,2005,2004,2003,2002,2001,2000,1999,1998,1997,1996,1995,1994,1993,1992,1991,1990,1989,1988,1987,1986,1985,1984,1983,1982,1981,1980,1979,1978,1977,1976,1975,1974,1973,1972
This statistics in other country:
AlbaniaAlgeriaAngolaArab WorldArgentinaArmeniaAustraliaAustriaAzerbaijanBahrainBangladeshBelarusBelgiumBeninBoliviaBosnia and HerzegovinaBotswanaBrazilBrunei DarussalamBulgariaCambodiaCameroonCanadaCentral Europe and the BalticsChileChinaColombiaCongo, Dem. Rep.Congo, Rep.Costa RicaCote d'IvoireCroatiaCubaCuracaoCyprusCzech RepublicDenmarkDominican RepublicEarly-demographic dividendEast Asia & PacificEast Asia & Pacific (excluding high income)East Asia & Pacific (IDA & IBRD countries)EcuadorEgypt, Arab Rep.El SalvadorEritreaEstoniaEthiopiaEuro areaEurope & Central AsiaEurope & Central Asia (excluding high income)Europe & Central Asia (IDA & IBRD countries)European UnionFinlandFragile and conflict affected situationsFranceGabonGeorgiaGermanyGhanaGibraltarGreeceGuatemalaHaitiHeavily indebted poor countries (HIPC)High incomeHondurasHong Kong SAR, ChinaHungaryIBRD onlyIcelandIDA & IBRD totalIDA blendIDA onlyIDA totalIndiaIndonesiaIran, Islamic Rep.IraqIrelandIsraelItalyJamaicaJapanJordanKazakhstanKenyaKorea, Dem. People’s Rep.Korea, Rep.KosovoKuwaitKyrgyz RepublicLate-demographic dividendLatin America & Caribbean Latin America & Caribbean (excluding high income)Latin America & the Caribbean (IDA & IBRD countries)LatviaLeast developed countries: UN classificationLebanonLibyaLithuaniaLow & middle incomeLower middle incomeLuxembourgMacedonia, FYRMalaysiaMaltaMauritiusMexicoMiddle East & North AfricaMiddle East & North Africa (excluding high income)Middle East & North Africa (IDA & IBRD countries)Middle incomeMoldovaMongoliaMontenegroMoroccoMozambiqueMyanmarNamibiaNepalNetherlandsNew ZealandNicaraguaNigerNigeriaNorth AmericaNorwayOECD membersOmanOther small statesPakistanPanamaParaguayPeruPhilippinesPolandPortugalPost-demographic dividendPre-demographic dividendQatarRomaniaRussian FederationSaudi ArabiaSenegalSerbiaSingaporeSlovak RepublicSloveniaSmall statesSouth AfricaSouth AsiaSouth Asia (IDA & IBRD)South SudanSpainSri LankaSub-Saharan Africa Sub-Saharan Africa (excluding high income)Sub-Saharan Africa (IDA & IBRD countries)SudanSwedenSwitzerlandSyrian Arab RepublicTajikistanTanzaniaThailandTogoTrinidad and TobagoTunisiaTurkeyTurkmenistanUkraineUnited Arab EmiratesUnited KingdomUnited StatesUpper middle incomeUruguayUzbekistanVenezuela, RBVietnamWorldYemen, Rep.ZambiaZimbabwe Timeline:
This timeline shows a graph from 1972 to 2014 of Late-demographic dividend. No data until 1971. Number of actual observations by date: 43.
Source name:
World Development Indicators
Source organization:
IEA Statistics © OECD/IEA 2014 (http://www.iea.org/stats/index.asp), subject to https://www.iea.org/t&c/termsandconditions/
Categories, topics:
Energy & Mining, Environment
Last updated:
apr 23, 2017
Indicators value changes by year
Minimum:
31.668
jan 1, 1986
At the date of observation
Value
Absolute change
Change from previous value
jan 1, 1972
34.513
+34.513
0.0%
jan 1, 1973
33.985
-0.528
-1.53%
jan 1, 1974
34.009
+0.025
0.07%
jan 1, 1975
32.853
-1.156
-3.4%
jan 1, 1976
33.469
+0.615
1.87%
jan 1, 1977
33.57
+0.101
0.3%
jan 1, 1978
33.472
-0.098
-0.29%
jan 1, 1979
34.303
+0.831
2.48%
jan 1, 1980
33.712
-0.591
-1.72%
jan 1, 1981
32.963
-0.748
-2.22%
jan 1, 1982
32.522
-0.441
-1.34%
jan 1, 1983
32.049
-0.473
-1.46%
jan 1, 1984
31.726
-0.323
-1.01%
jan 1, 1985
31.701
-0.025
-0.08%
jan 1, 1986
31.668
-0.033
-0.1%
jan 1, 1987
32.303
+0.635
2.0%
jan 1, 1988
32.759
+0.455
1.41%
jan 1, 1989
32.667
-0.092
-0.28%
jan 1, 1990
32.79
+0.123
0.38%
jan 1, 1991
68.957
+36.166
110.29%
jan 1, 1992
68.76
-0.196
-0.28%
jan 1, 1993
68.446
-0.314
-0.46%
jan 1, 1994
67.516
-0.931
-1.36%
jan 1, 1995
66.896
-0.619
-0.92%
jan 1, 1996
66.668
-0.228
-0.34%
jan 1, 1997
67.593
+0.924
1.39%
jan 1, 1998
67.514
-0.079
-0.12%
jan 1, 1999
67.455
-0.059
-0.09%
jan 1, 2000
67.834
+0.38
0.56%
jan 1, 2001
68.101
+0.267
0.39%
jan 1, 2002
67.944
-0.157
-0.23%
jan 1, 2003
68.721
+0.777
1.14%
jan 1, 2004
70.406
+1.685
2.45%
jan 1, 2005
70.303
-0.103
-0.15%
jan 1, 2006
70.898
+0.595
0.85%
jan 1, 2007
71.97
+1.072
1.51%
jan 1, 2008
72.579
+0.608
0.85%
jan 1, 2009
71.852
-0.726
-1.0%
jan 1, 2010
71.497
-0.356
-0.5%
jan 1, 2011
71.518
+0.021
0.03%
jan 1, 2012
72.71
+1.193
1.67%
jan 1, 2013
71.127
-1.583
-2.18%
jan 1, 2014
71.122
-0.005
-0.01%
Ranking of countries by current statistics by years


Comments: