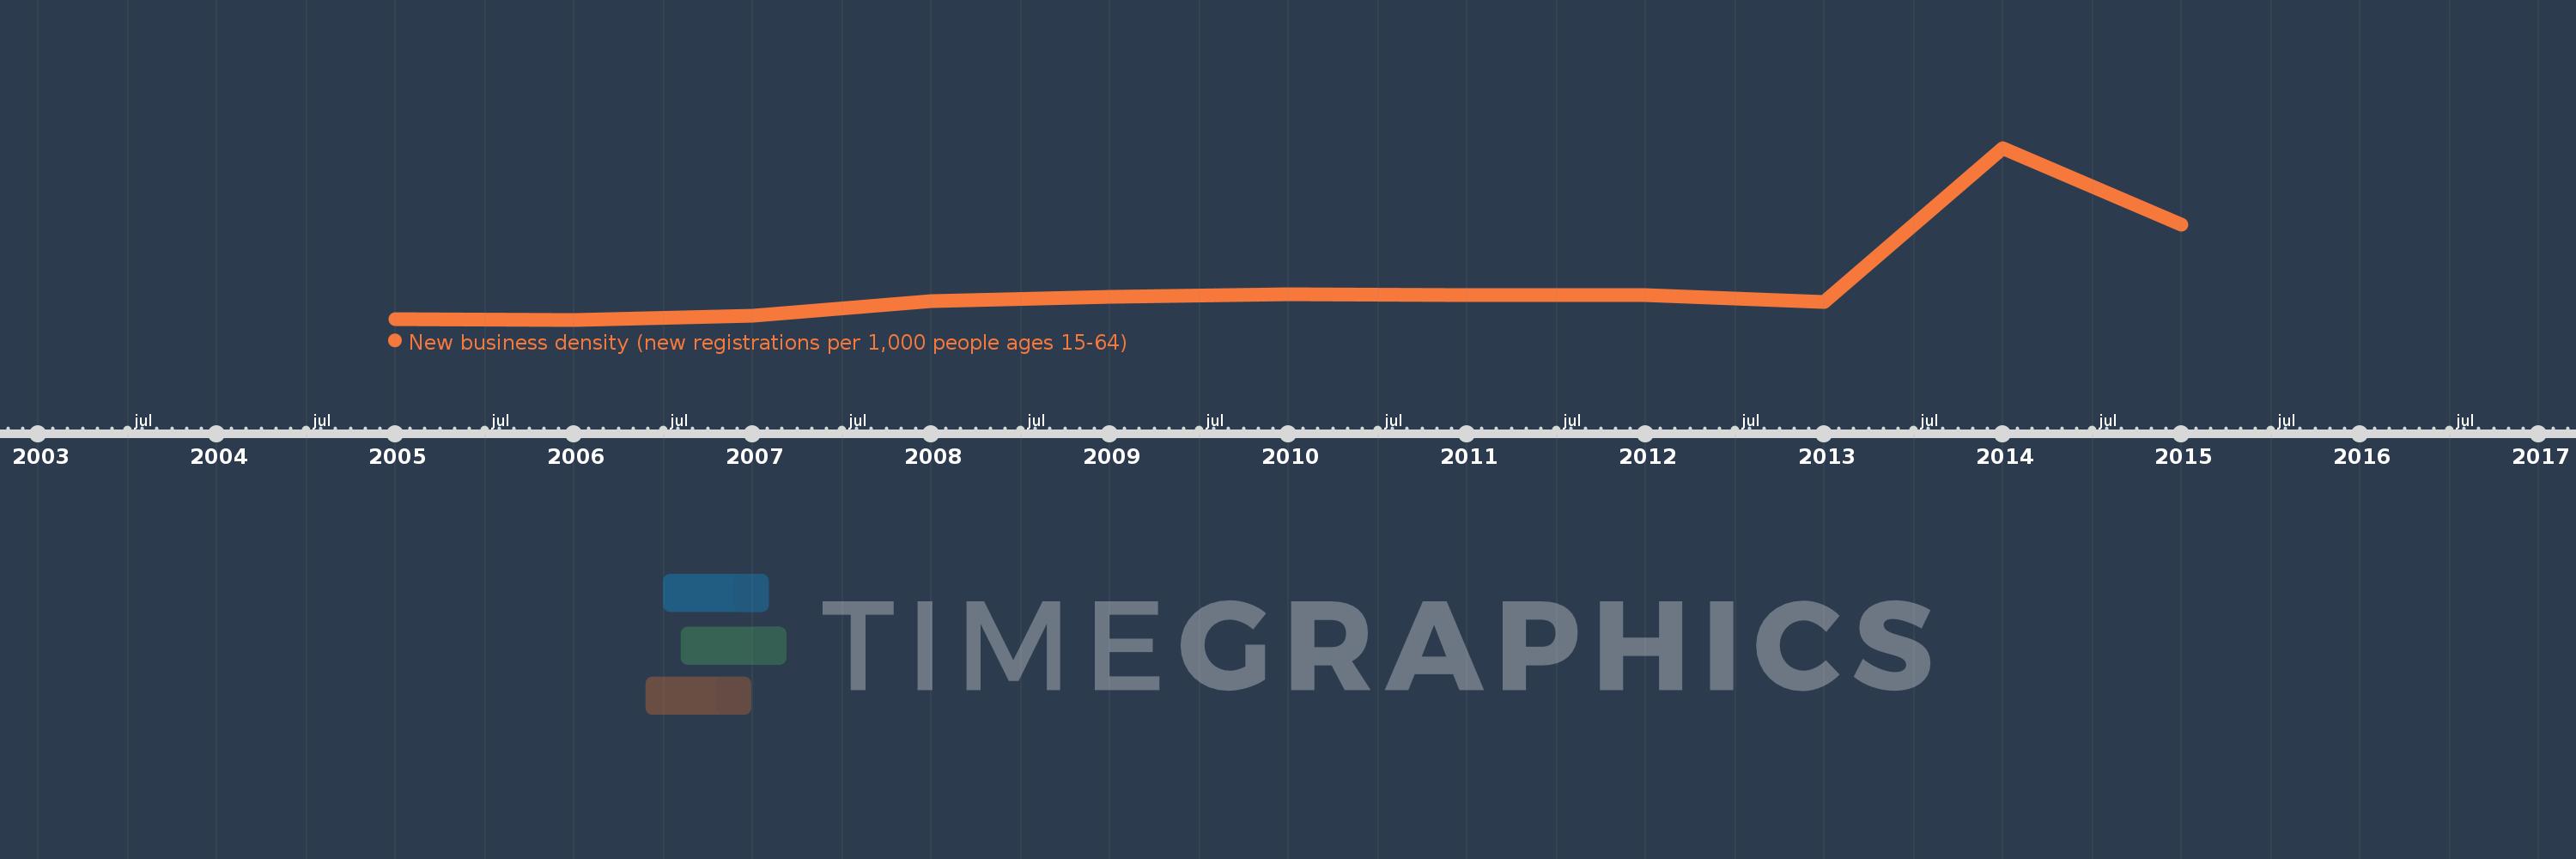
This timeline shows a graph from 2005 to 2015 of Middle East & North Africa (excluding high income). No data until 2004. Number of actual observations by date: 11.
Source name:
World Development Indicators
Source organization:
World Bank's Entrepreneurship Survey and database (http://econ.worldbank.org/research/entrepreneurship).
Categories, topics:
Private Sector
Last updated:
apr 23, 2017
Indicators value changes by year
Meaning:
0.667
Minimum:
0.434
jan 1, 2006
Maximum:
1.52
jan 1, 2014
At the date of observation
Value
Absolute change
Change from the previous value
jan 1, 2005
0.437
+0.437
0.0%
jan 1, 2006
0.434
-0.003
-0.66%
jan 1, 2007
0.462
+0.028
6.41%
jan 1, 2008
0.55
+0.089
19.23%
jan 1, 2009
0.579
+0.029
5.25%
jan 1, 2010
0.593
+0.013
2.27%
jan 1, 2011
0.591
-0.001
-0.21%
jan 1, 2012
0.588
-0.003
-0.55%
jan 1, 2013
0.548
-0.04
-6.77%
jan 1, 2014
1.52
+0.972
177.26%
jan 1, 2015
1.037
-0.483
-31.8%
Ranking of countries by current statistics by years
