29
/
en
AIzaSyAYiBZKx7MnpbEhh9jyipgxe19OcubqV5w
April 1, 2024
215630
Oman
OMN
true
2
1
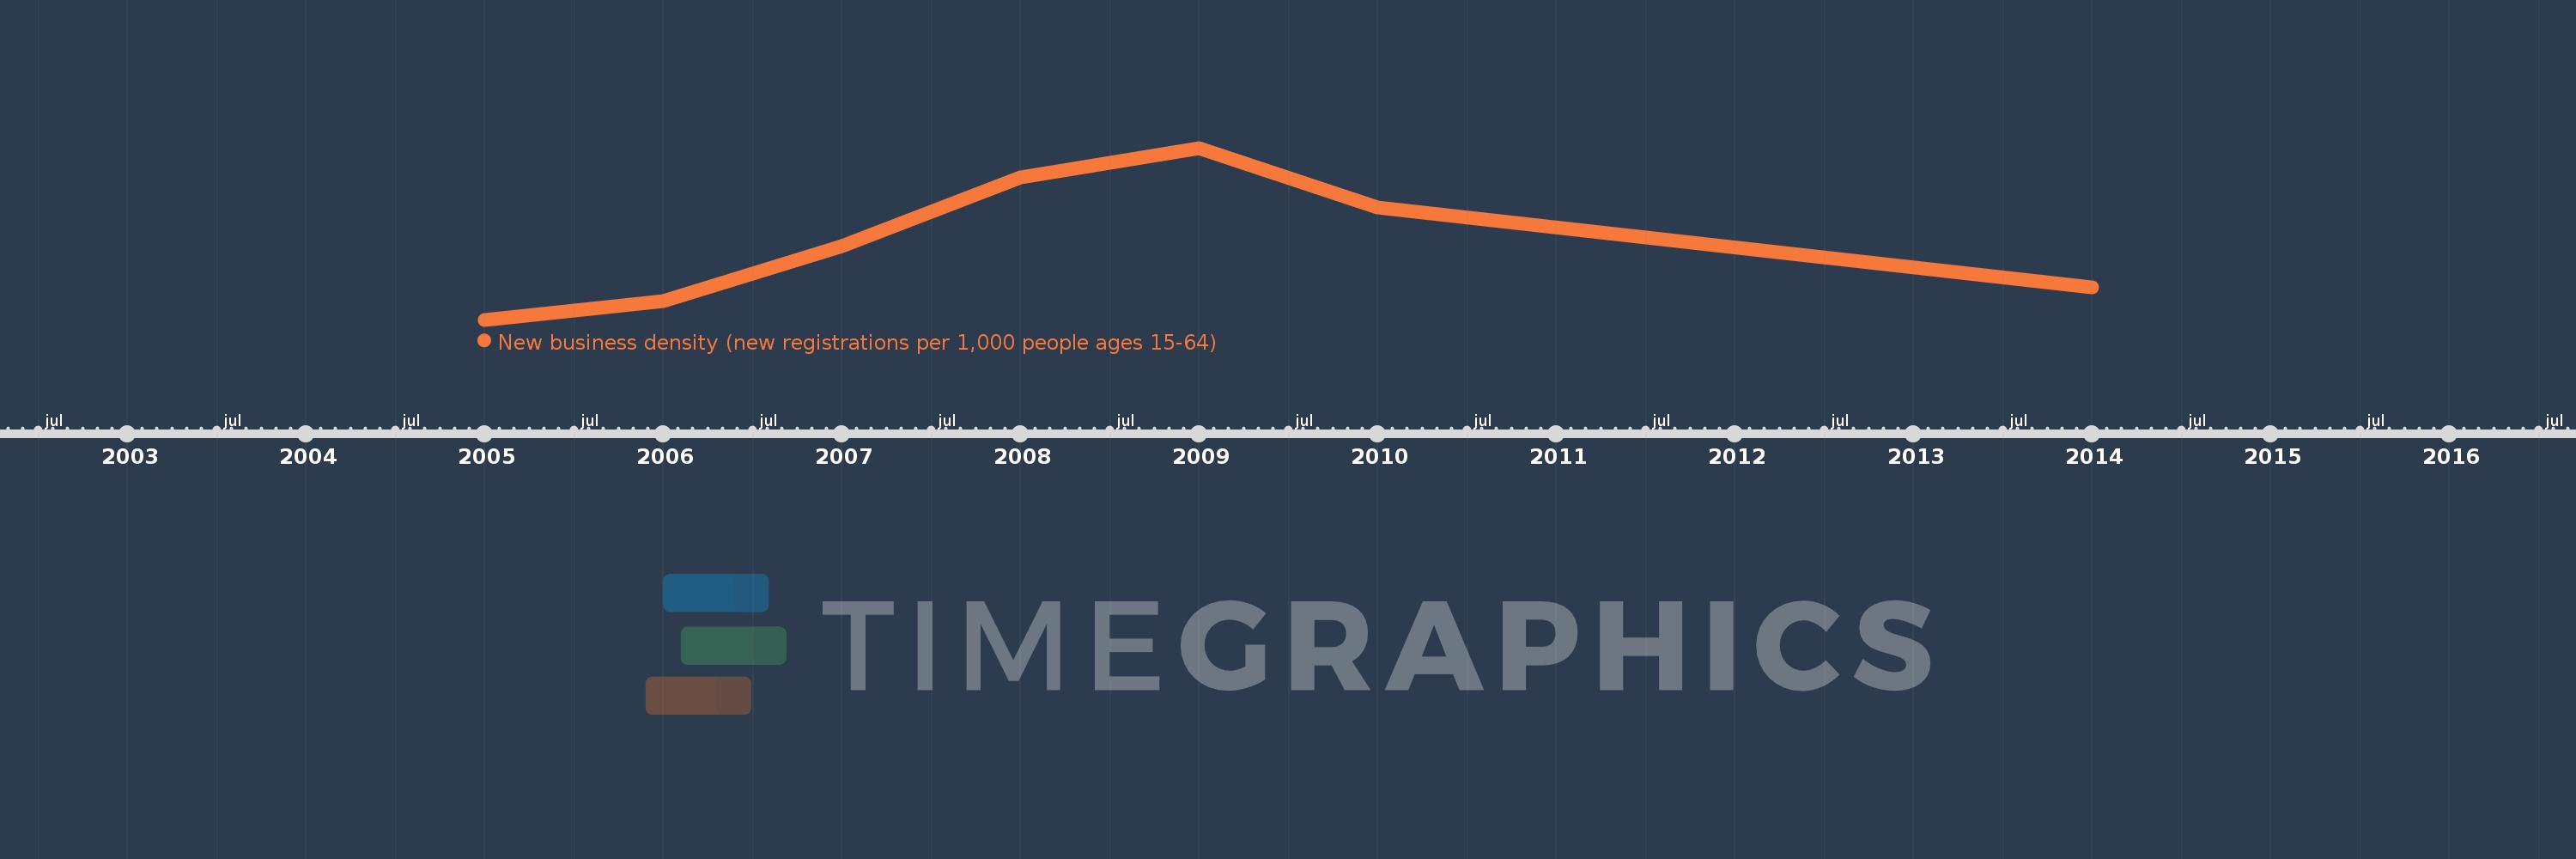
New business density (new registrations per 1,000 people ages 15-64)
2014,2010,2009,2008,2007,2006,2005
This statistics in other country:
Timeline:
This timeline shows a graph from 2005 to 2014 of Oman. No data until 2004. Number of actual observations by date: 7.
Source name:
World Development Indicators
Source organization:
World Bank's Entrepreneurship Survey and database (http://econ.worldbank.org/research/entrepreneurship).
Categories, topics:
Private Sector
Last updated:
apr 23, 2017
Indicators value changes by year
At the date of observation
Value
Absolute change
Change from previous value
jan 1, 2005
0.725
+0.725
0.0%
jan 1, 2006
0.897
+0.172
23.79%
jan 1, 2007
1.388
+0.491
54.77%
jan 1, 2008
2.01
+0.621
44.76%
jan 1, 2009
2.278
+0.268
13.33%
jan 1, 2010
1.739
-0.538
-23.63%
jan 1, 2014
1.02
-0.719
-41.36%
Ranking of countries by current statistics by years


Comments: