29
/
en
AIzaSyAYiBZKx7MnpbEhh9jyipgxe19OcubqV5w
April 1, 2024
36863
IBRD only
IBD
false
2
1
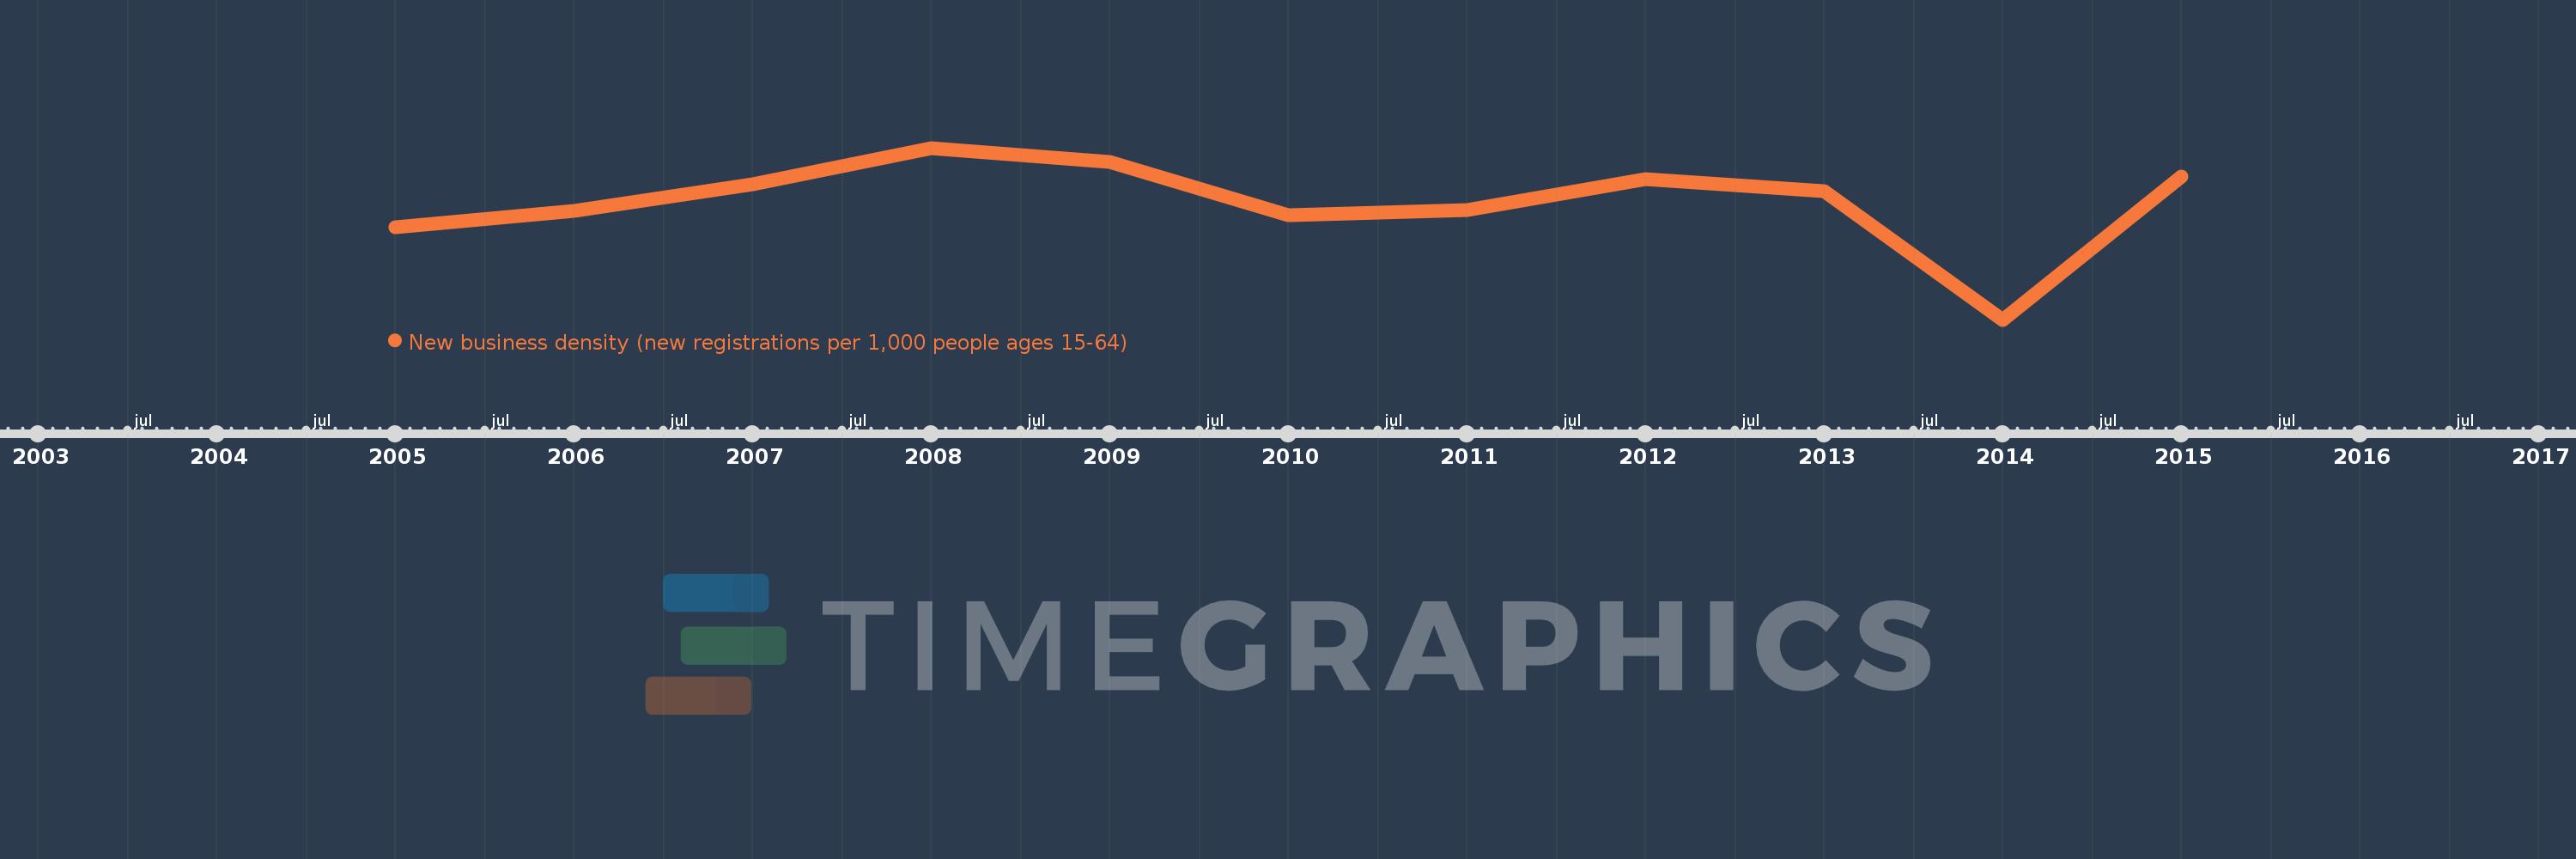
New business density (new registrations per 1,000 people ages 15-64)
2015,2014,2013,2012,2011,2010,2009,2008,2007,2006,2005
This statistics in other country:
Timeline:
This timeline shows a graph from 2005 to 2015 of IBRD only. No data until 2004. Number of actual observations by date: 11.
Source name:
World Development Indicators
Source organization:
World Bank's Entrepreneurship Survey and database (http://econ.worldbank.org/research/entrepreneurship).
Categories, topics:
Private Sector
Last updated:
apr 23, 2017
Indicators value changes by year
At the date of observation
Value
Absolute change
Change from previous value
jan 1, 2005
2.349
+2.349
0.0%
jan 1, 2006
2.536
+0.187
7.98%
jan 1, 2007
2.833
+0.297
11.7%
jan 1, 2008
3.235
+0.402
14.19%
jan 1, 2009
3.079
-0.156
-4.82%
jan 1, 2010
2.482
-0.596
-19.37%
jan 1, 2011
2.545
+0.063
2.53%
jan 1, 2012
2.885
+0.34
13.36%
jan 1, 2013
2.752
-0.133
-4.6%
jan 1, 2014
1.315
-1.437
-52.22%
jan 1, 2015
2.92
+1.605
122.05%
Ranking of countries by current statistics by years


Comments: