29
/
en
AIzaSyAYiBZKx7MnpbEhh9jyipgxe19OcubqV5w
April 1, 2024
158773
Iraq
IRQ
true
2
1
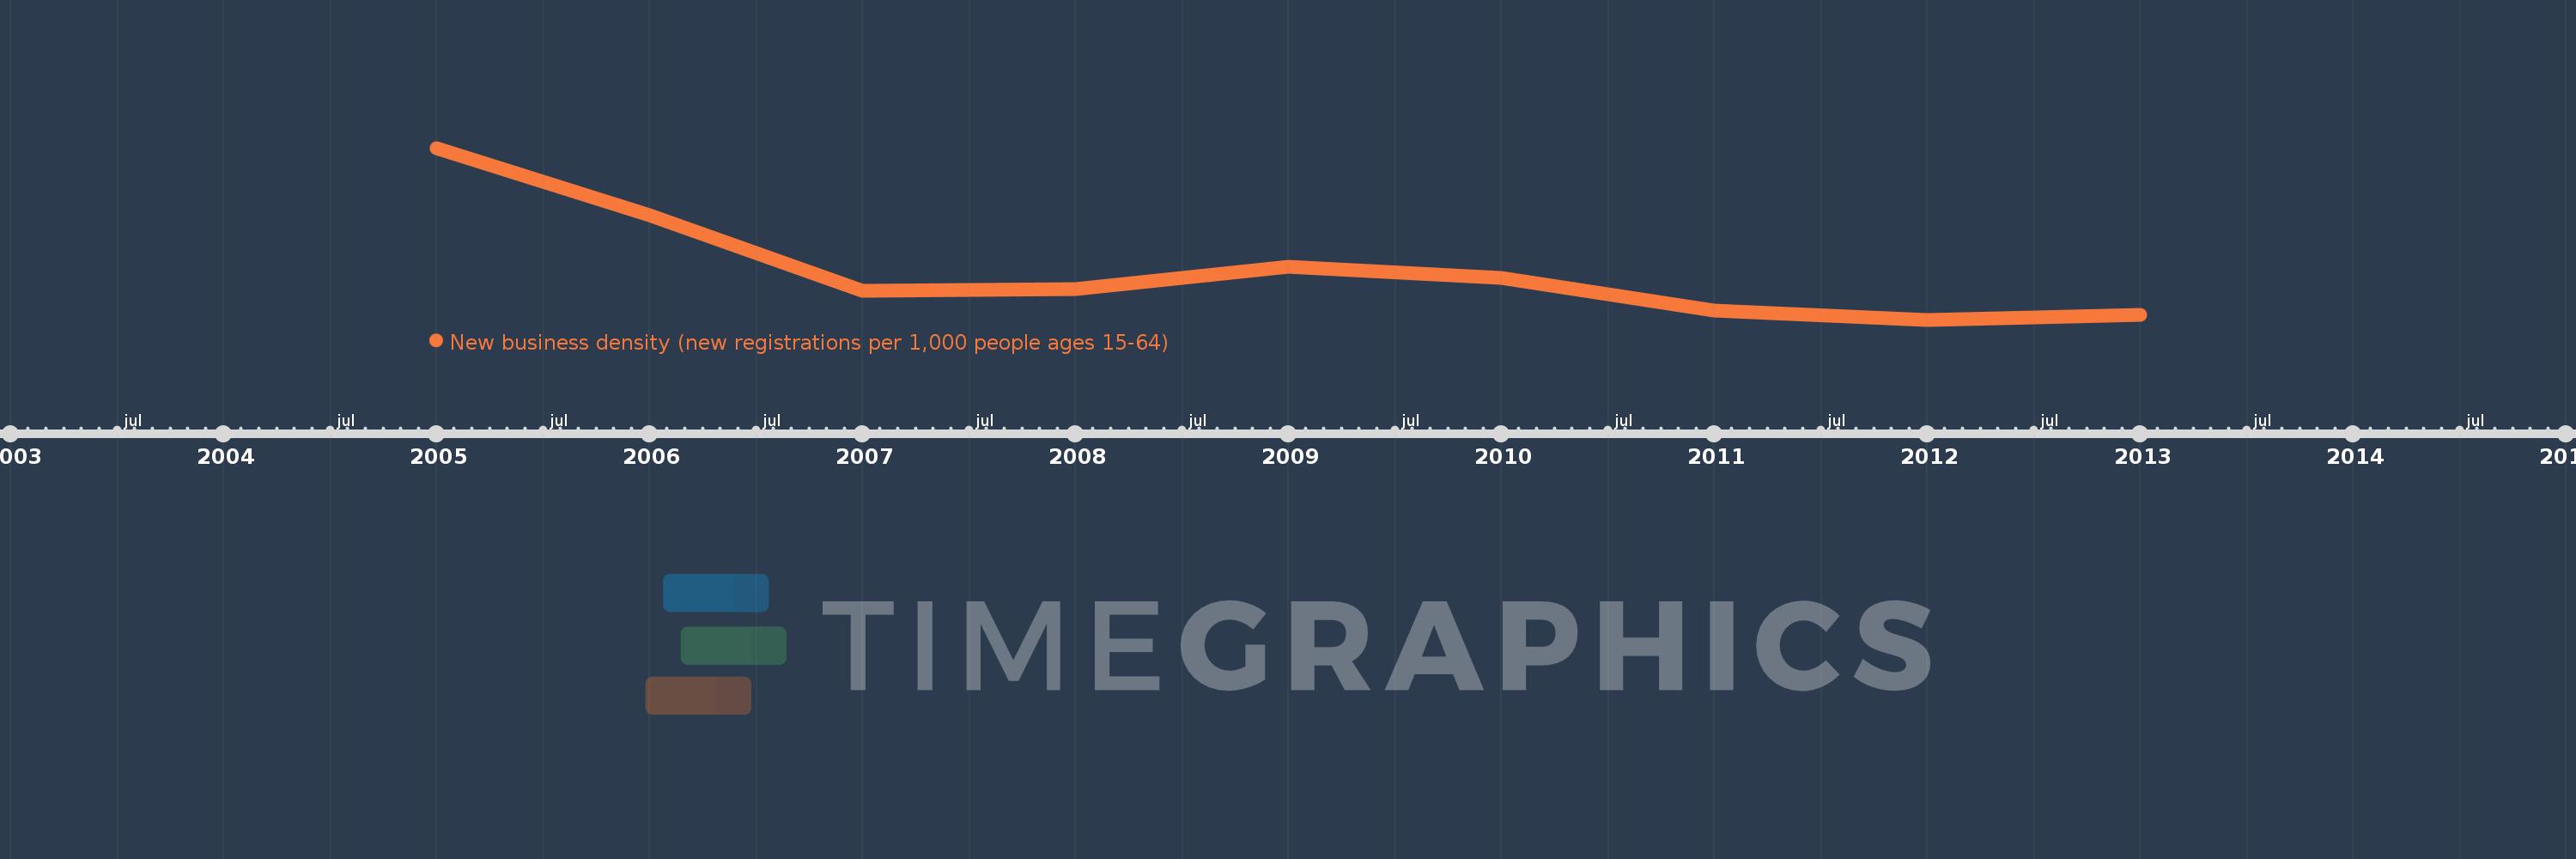
New business density (new registrations per 1,000 people ages 15-64)
2013,2012,2011,2010,2009,2008,2007,2006,2005
This statistics in other country:
Timeline:
This timeline shows a graph from 2005 to 2013 of Iraq. No data until 2004. Number of actual observations by date: 9.
Source name:
World Development Indicators
Source organization:
World Bank's Entrepreneurship Survey and database (http://econ.worldbank.org/research/entrepreneurship).
Categories, topics:
Private Sector
Last updated:
apr 23, 2017
Indicators value changes by year
At the date of observation
Value
Absolute change
Change from previous value
jan 1, 2005
0.783
+0.783
0.0%
jan 1, 2006
0.519
-0.264
-33.73%
jan 1, 2007
0.225
-0.294
-56.65%
jan 1, 2008
0.229
+0.003
1.53%
jan 1, 2009
0.318
+0.089
38.97%
jan 1, 2010
0.273
-0.045
-14.12%
jan 1, 2011
0.146
-0.127
-46.55%
jan 1, 2012
0.11
-0.036
-24.75%
jan 1, 2013
0.13
+0.02
18.53%
Ranking of countries by current statistics by years


Comments: