29
/
en
AIzaSyAYiBZKx7MnpbEhh9jyipgxe19OcubqV5w
April 1, 2024
101404
Canada
CAN
true
2
1
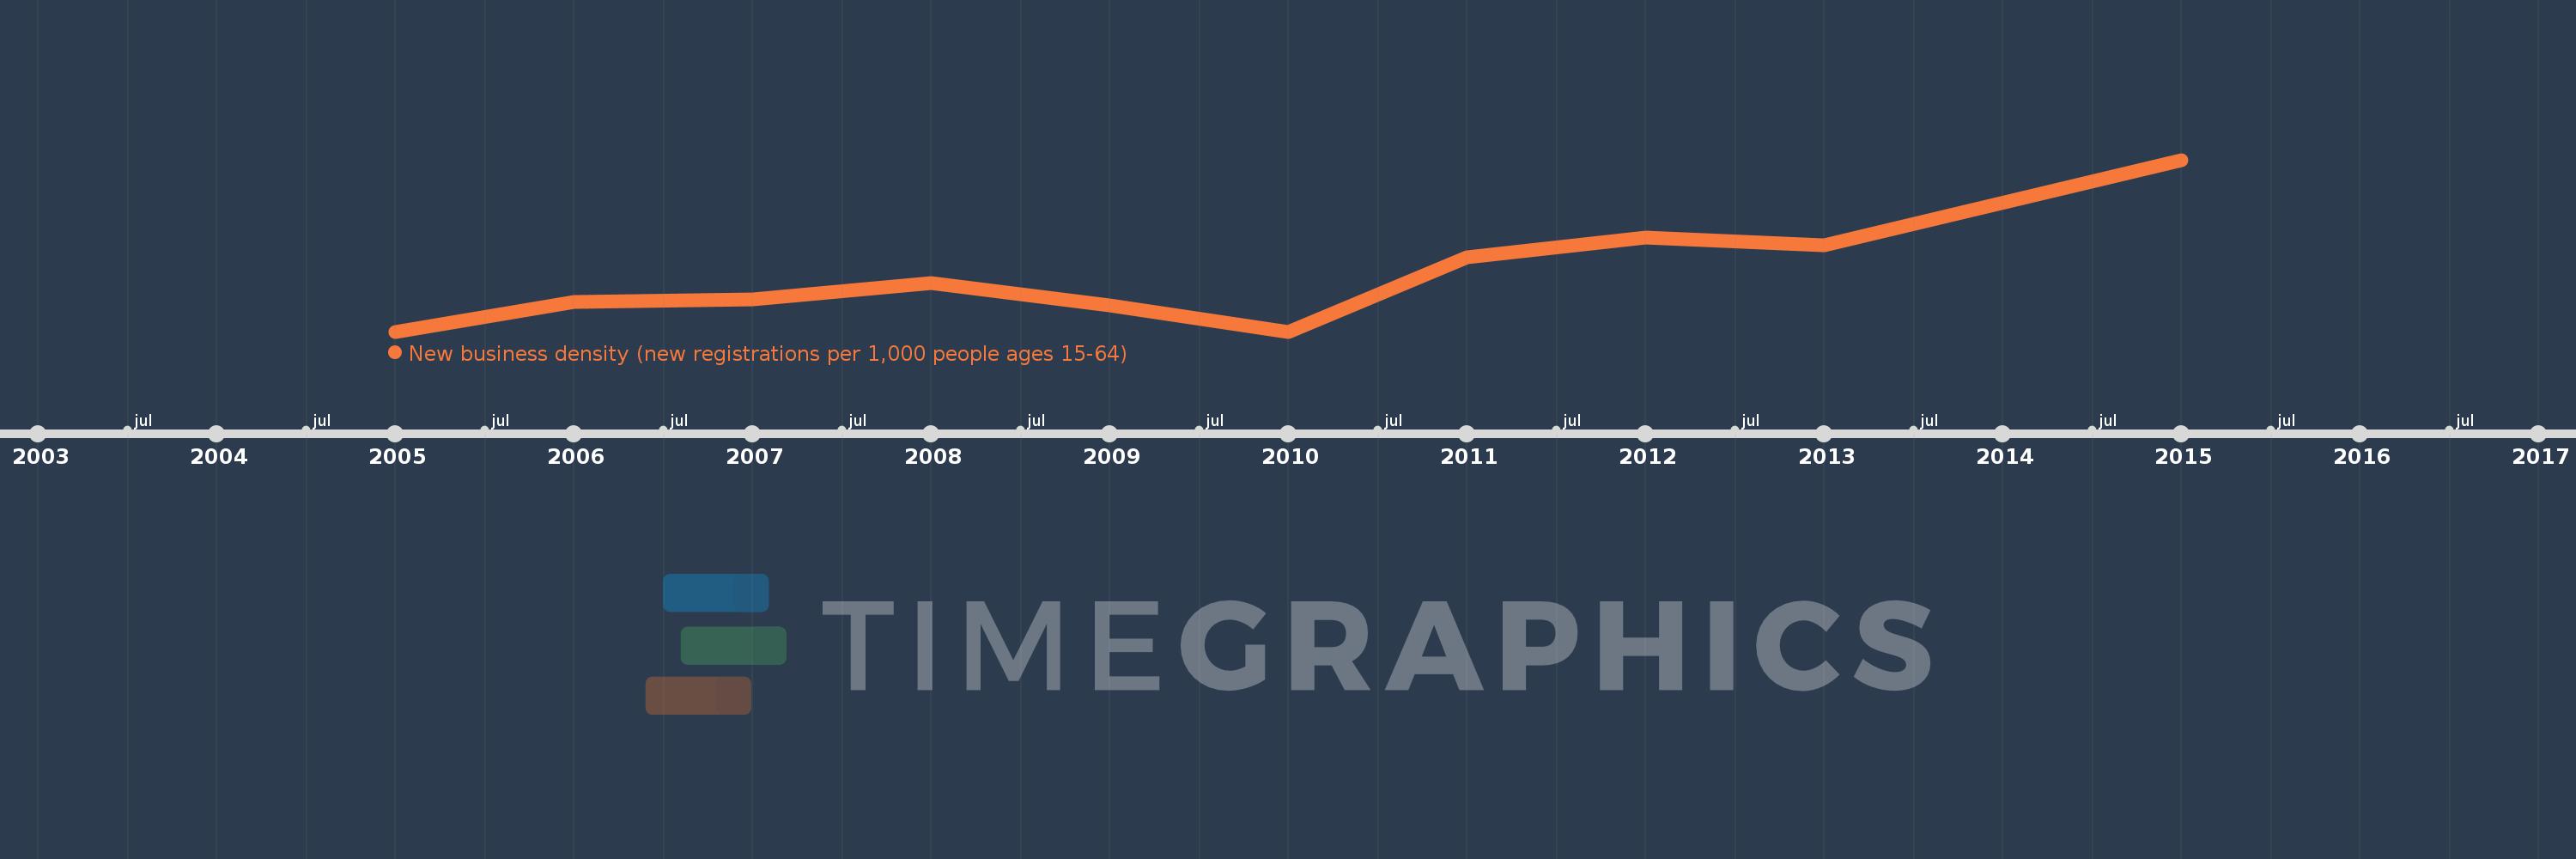
New business density (new registrations per 1,000 people ages 15-64)
2015,2013,2012,2011,2010,2009,2008,2007,2006,2005
This statistics in other country:
Timeline:
This timeline shows a graph from 2005 to 2015 of Canada. No data until 2004. Number of actual observations by date: 10.
Source name:
World Development Indicators
Source organization:
World Bank's Entrepreneurship Survey and database (http://econ.worldbank.org/research/entrepreneurship).
Categories, topics:
Private Sector
Last updated:
apr 23, 2017
Indicators value changes by year
At the date of observation
Value
Absolute change
Change from previous value
jan 1, 2005
0.861
+0.861
0.0%
jan 1, 2006
0.933
+0.072
8.36%
jan 1, 2007
0.94
+0.007
0.77%
jan 1, 2008
0.98
+0.04
4.25%
jan 1, 2009
0.925
-0.055
-5.61%
jan 1, 2010
0.861
-0.064
-6.89%
jan 1, 2011
1.042
+0.18
20.93%
jan 1, 2012
1.09
+0.048
4.63%
jan 1, 2013
1.072
-0.018
-1.67%
jan 1, 2015
1.28
+0.208
19.44%
Ranking of countries by current statistics by years


Comments: