29
/
en
AIzaSyAYiBZKx7MnpbEhh9jyipgxe19OcubqV5w
April 1, 2024
55753
Pre-demographic dividend
PRE
false
2
1
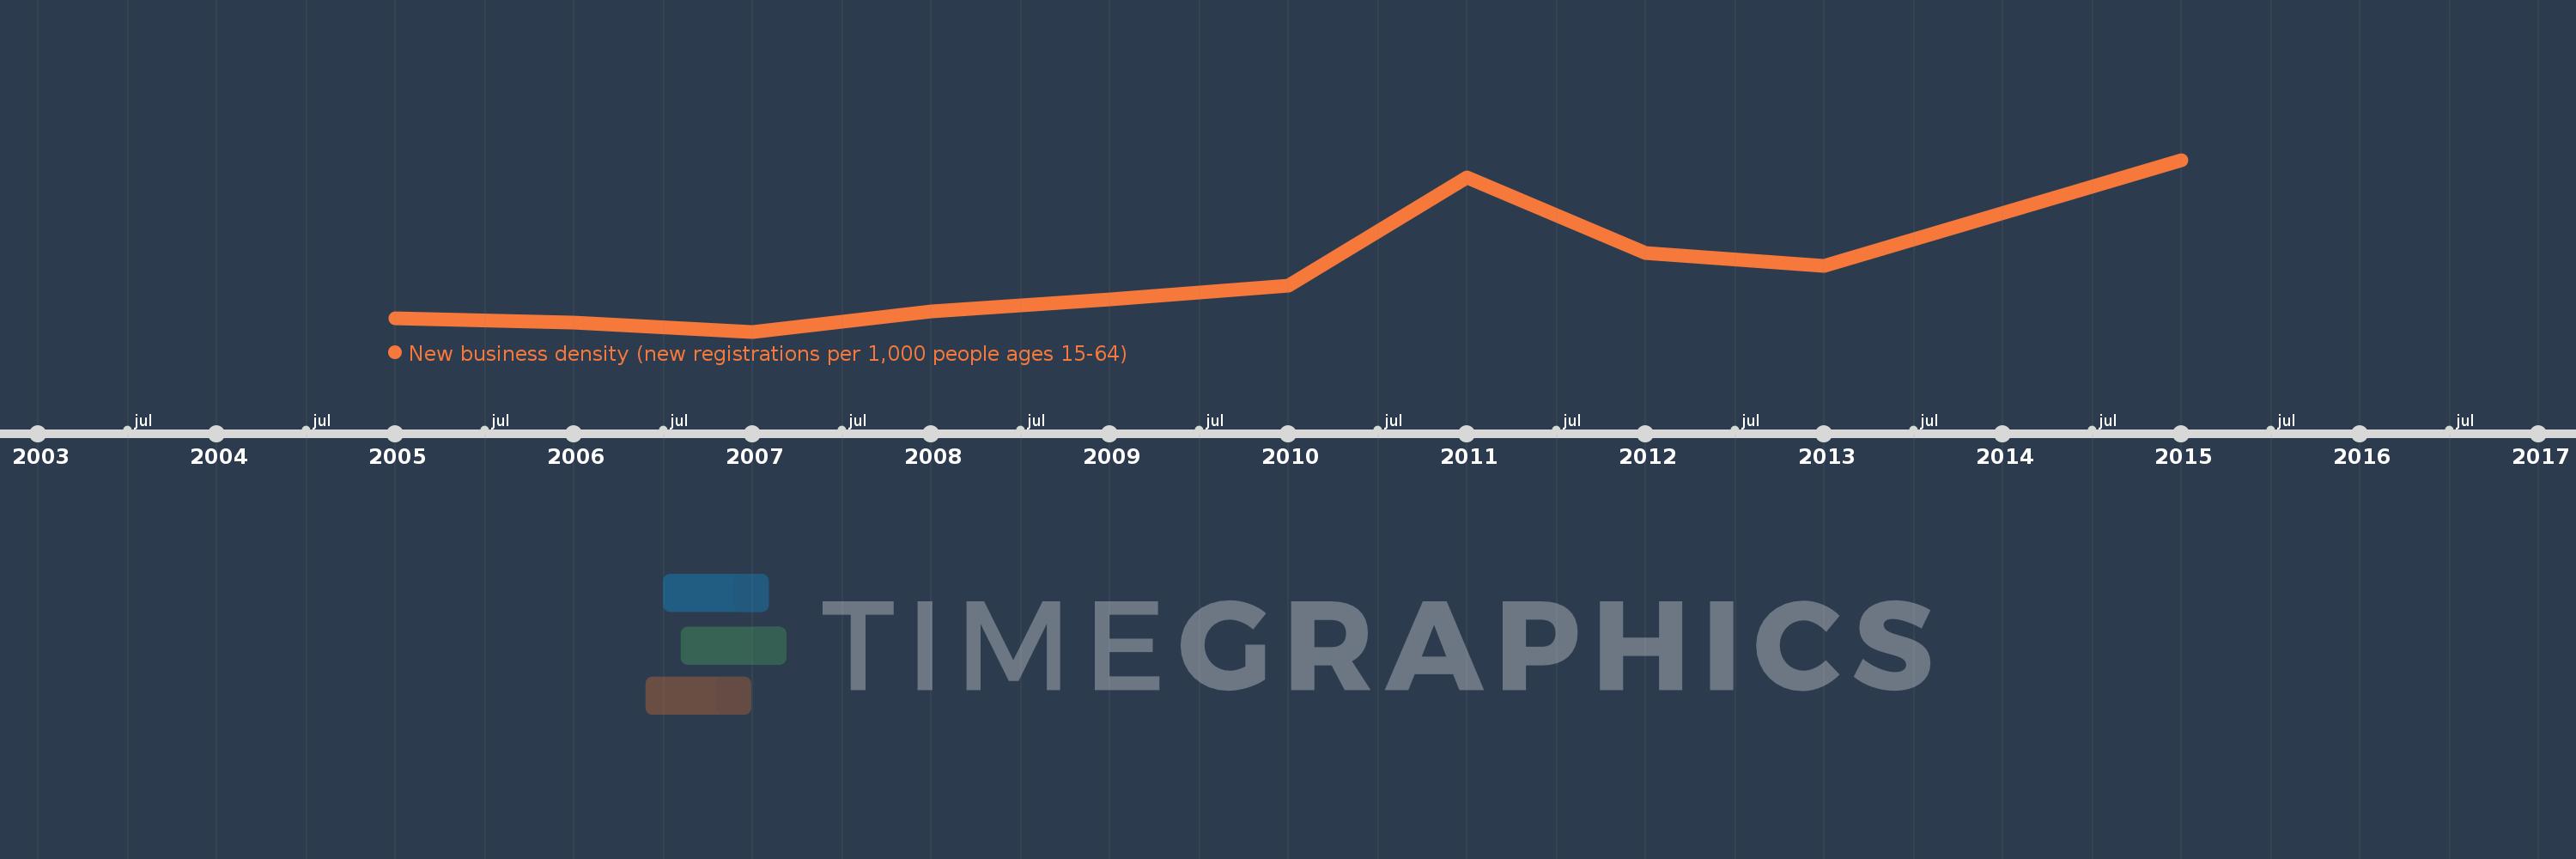
New business density (new registrations per 1,000 people ages 15-64)
2015,2013,2012,2011,2010,2009,2008,2007,2006,2005
This statistics in other country:
Timeline:
This timeline shows a graph from 2005 to 2015 of Pre-demographic dividend. No data until 2004. Number of actual observations by date: 10.
Source name:
World Development Indicators
Source organization:
World Bank's Entrepreneurship Survey and database (http://econ.worldbank.org/research/entrepreneurship).
Categories, topics:
Private Sector
Last updated:
apr 23, 2017
Indicators value changes by year
At the date of observation
Value
Absolute change
Change from previous value
jan 1, 2005
0.301
+0.301
0.0%
jan 1, 2006
0.282
-0.019
-6.19%
jan 1, 2007
0.235
-0.047
-16.74%
jan 1, 2008
0.336
+0.101
43.07%
jan 1, 2009
0.398
+0.062
18.41%
jan 1, 2010
0.469
+0.071
17.83%
jan 1, 2011
1.017
+0.548
116.8%
jan 1, 2012
0.633
-0.384
-37.81%
jan 1, 2013
0.569
-0.063
-10.04%
jan 1, 2015
1.107
+0.538
94.48%
Ranking of countries by current statistics by years


Comments: