29
/
en
AIzaSyAYiBZKx7MnpbEhh9jyipgxe19OcubqV5w
April 1, 2024
246023
South Africa
ZAF
true
2
1
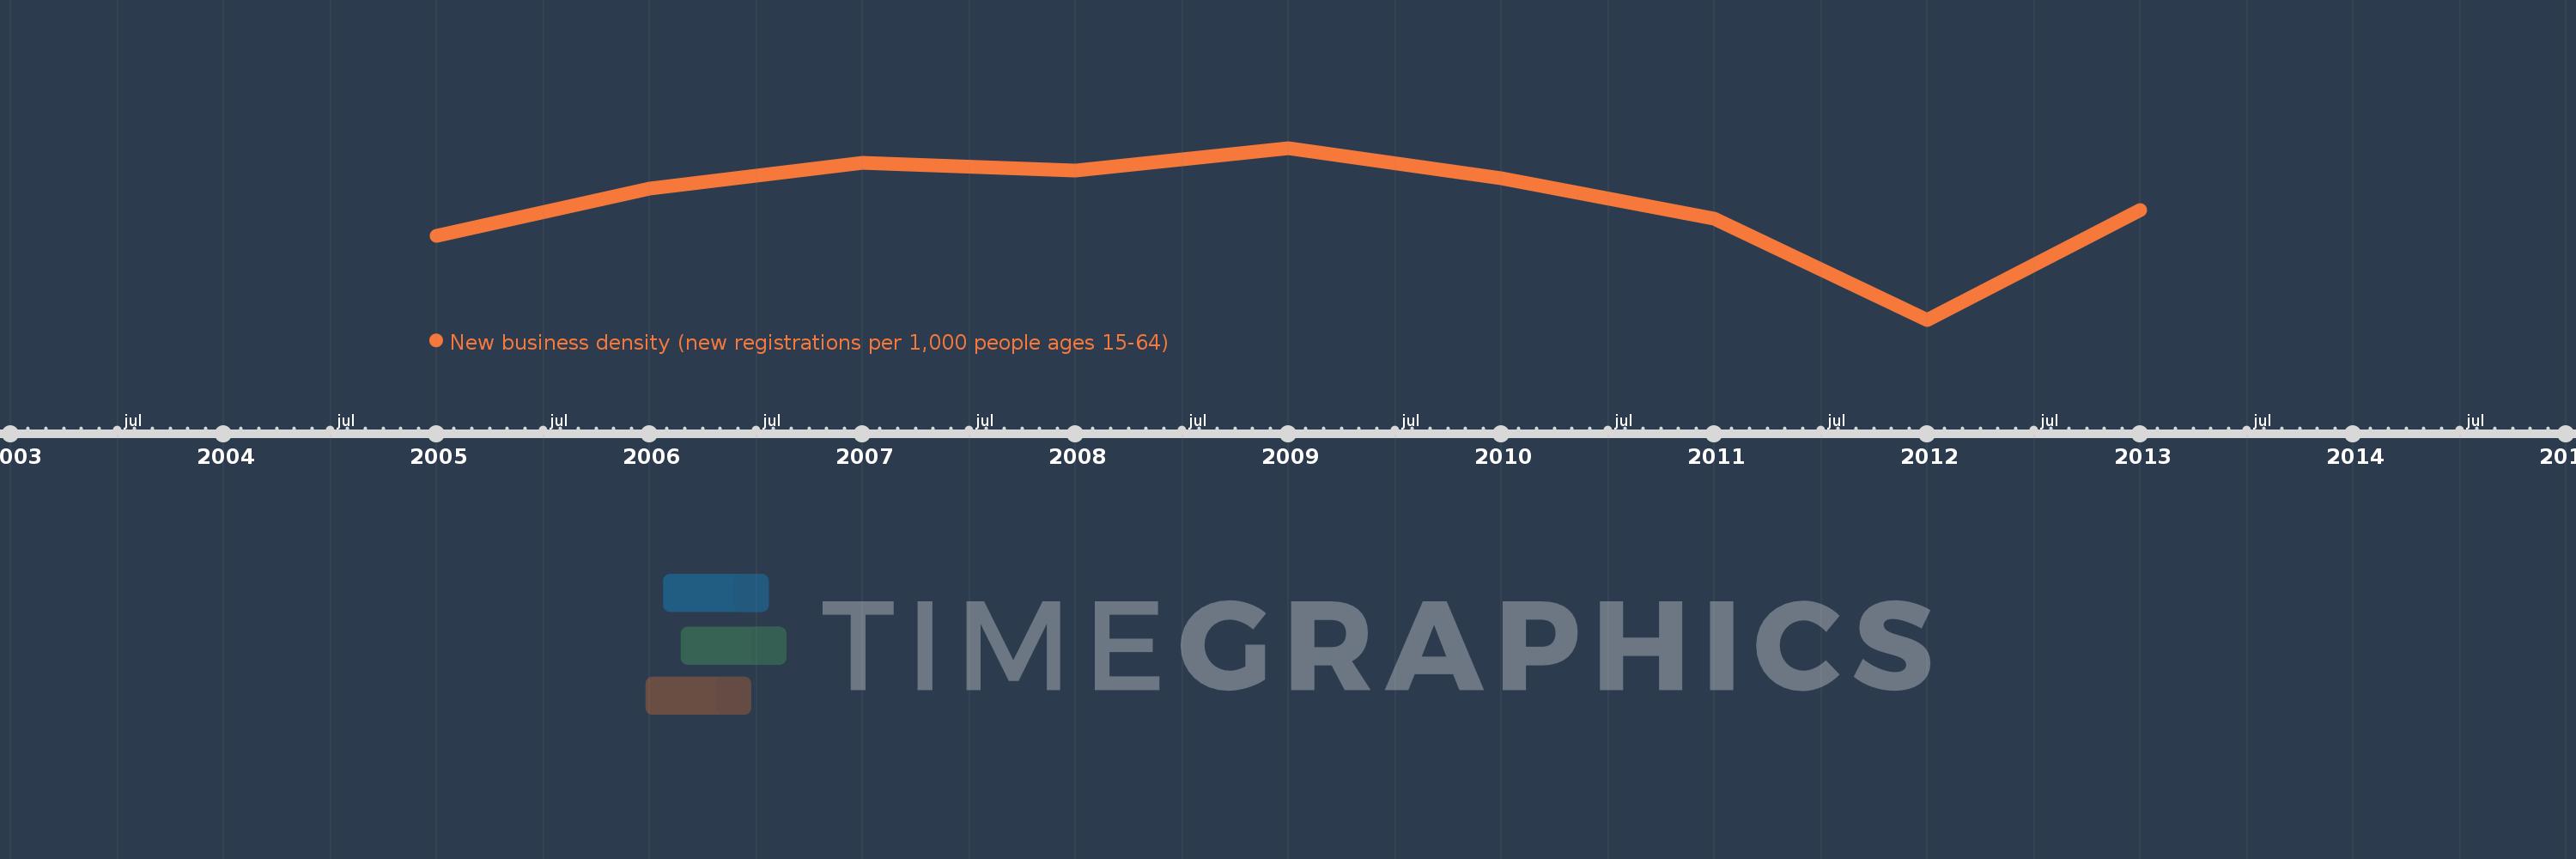
New business density (new registrations per 1,000 people ages 15-64)
2013,2012,2011,2010,2009,2008,2007,2006,2005
This statistics in other country:
Timeline:
This timeline shows a graph from 2005 to 2013 of South Africa. No data until 2004. Number of actual observations by date: 9.
Source name:
World Development Indicators
Source organization:
World Bank's Entrepreneurship Survey and database (http://econ.worldbank.org/research/entrepreneurship).
Categories, topics:
Private Sector
Last updated:
apr 23, 2017
Indicators value changes by year
At the date of observation
Value
Absolute change
Change from previous value
jan 1, 2005
5.434
+5.434
0.0%
jan 1, 2006
7.442
+2.008
36.95%
jan 1, 2007
8.544
+1.102
14.81%
jan 1, 2008
8.23
-0.315
-3.68%
jan 1, 2009
9.181
+0.951
11.55%
jan 1, 2010
7.892
-1.289
-14.04%
jan 1, 2011
6.141
-1.75
-22.18%
jan 1, 2012
1.82
-4.321
-70.36%
jan 1, 2013
6.537
+4.717
259.2%
Ranking of countries by current statistics by years


Comments: