29
/
en
AIzaSyAYiBZKx7MnpbEhh9jyipgxe19OcubqV5w
April 1, 2024
133464
Finland
FIN
true
2
1
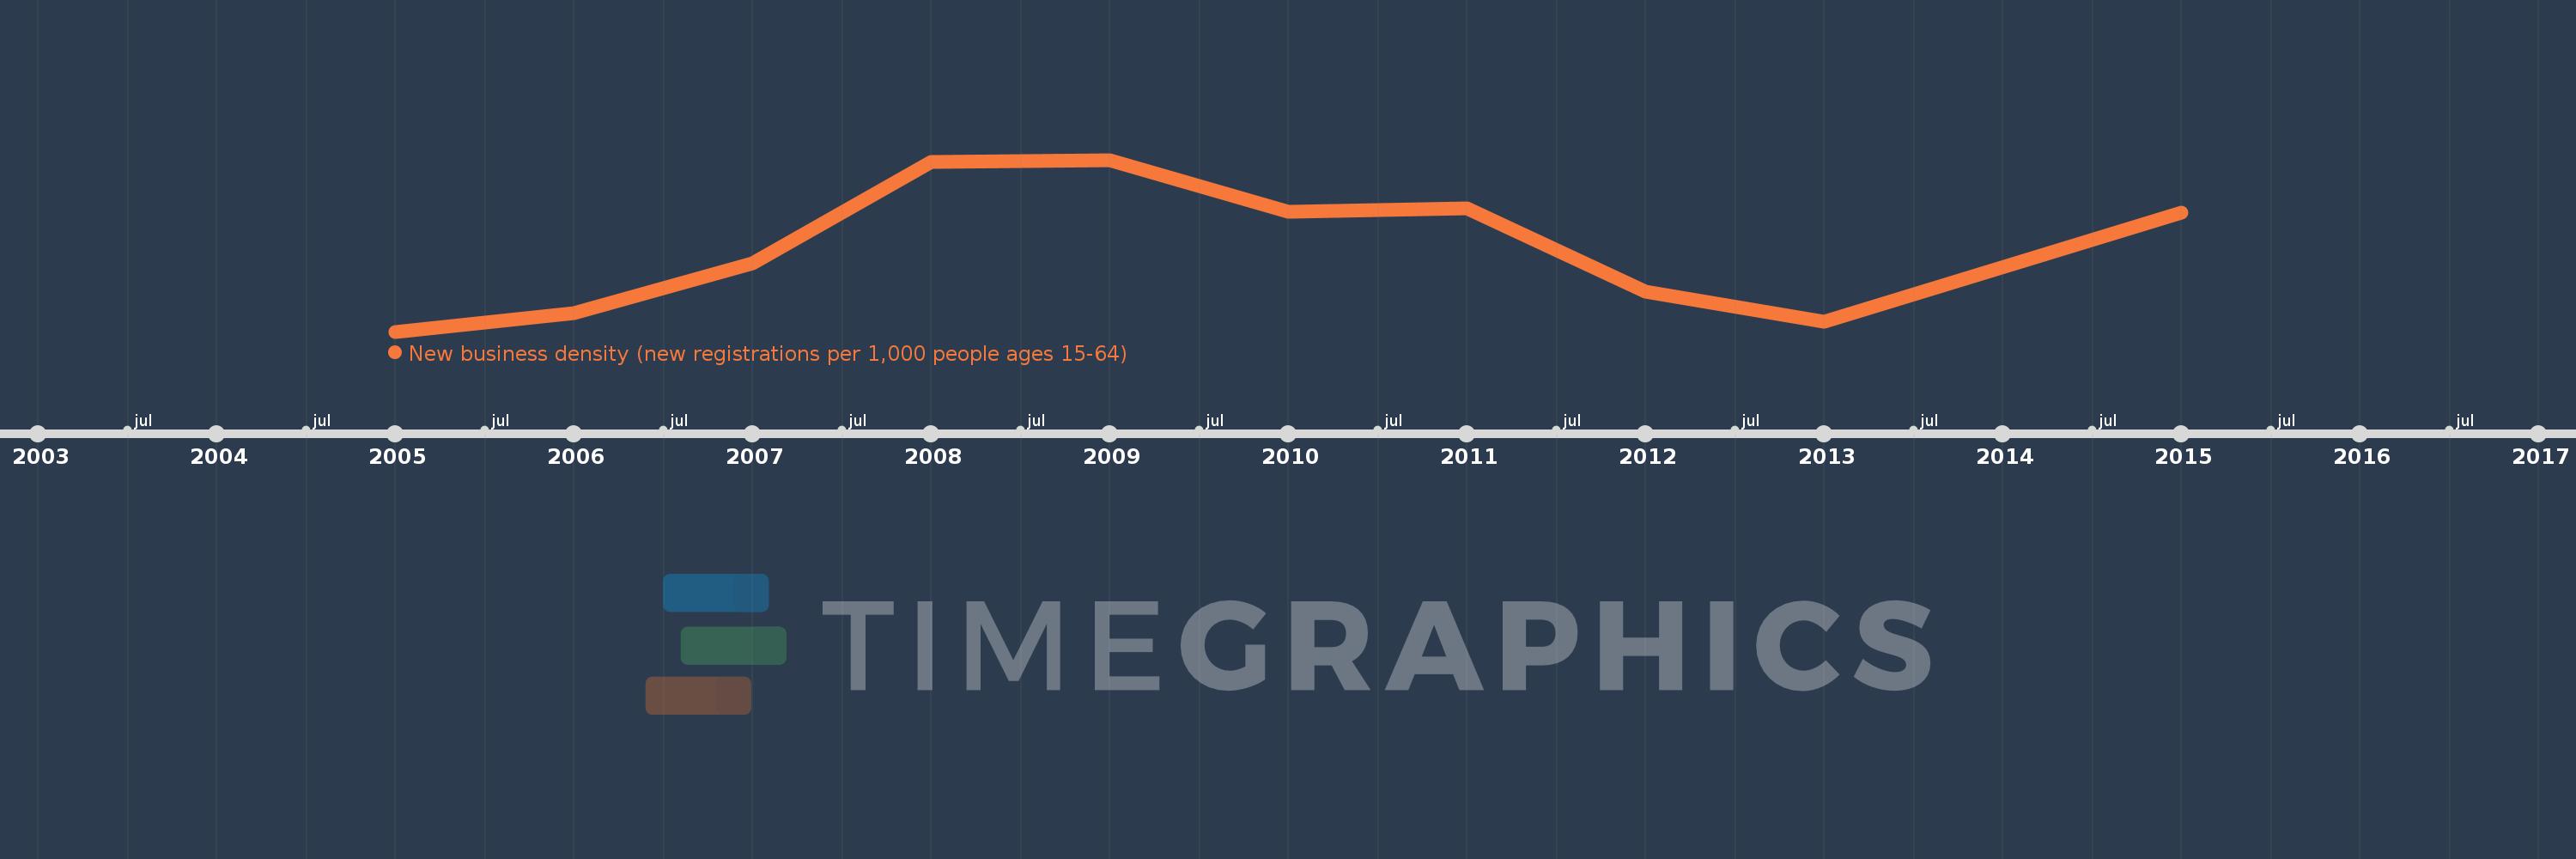
New business density (new registrations per 1,000 people ages 15-64)
2015,2013,2012,2011,2010,2009,2008,2007,2006,2005
This statistics in other country:
Timeline:
This timeline shows a graph from 2005 to 2015 of Finland. No data until 2004. Number of actual observations by date: 10.
Source name:
World Development Indicators
Source organization:
World Bank's Entrepreneurship Survey and database (http://econ.worldbank.org/research/entrepreneurship).
Categories, topics:
Private Sector
Last updated:
apr 23, 2017
Indicators value changes by year
At the date of observation
Value
Absolute change
Change from previous value
jan 1, 2005
2.216
+2.216
0.0%
jan 1, 2006
2.408
+0.192
8.69%
jan 1, 2007
2.917
+0.509
21.12%
jan 1, 2008
3.951
+1.034
35.46%
jan 1, 2009
3.973
+0.022
0.55%
jan 1, 2010
3.444
-0.529
-13.31%
jan 1, 2011
3.481
+0.037
1.08%
jan 1, 2012
2.621
-0.861
-24.72%
jan 1, 2013
2.316
-0.305
-11.62%
jan 1, 2015
3.43
+1.114
48.09%
Ranking of countries by current statistics by years


Comments: