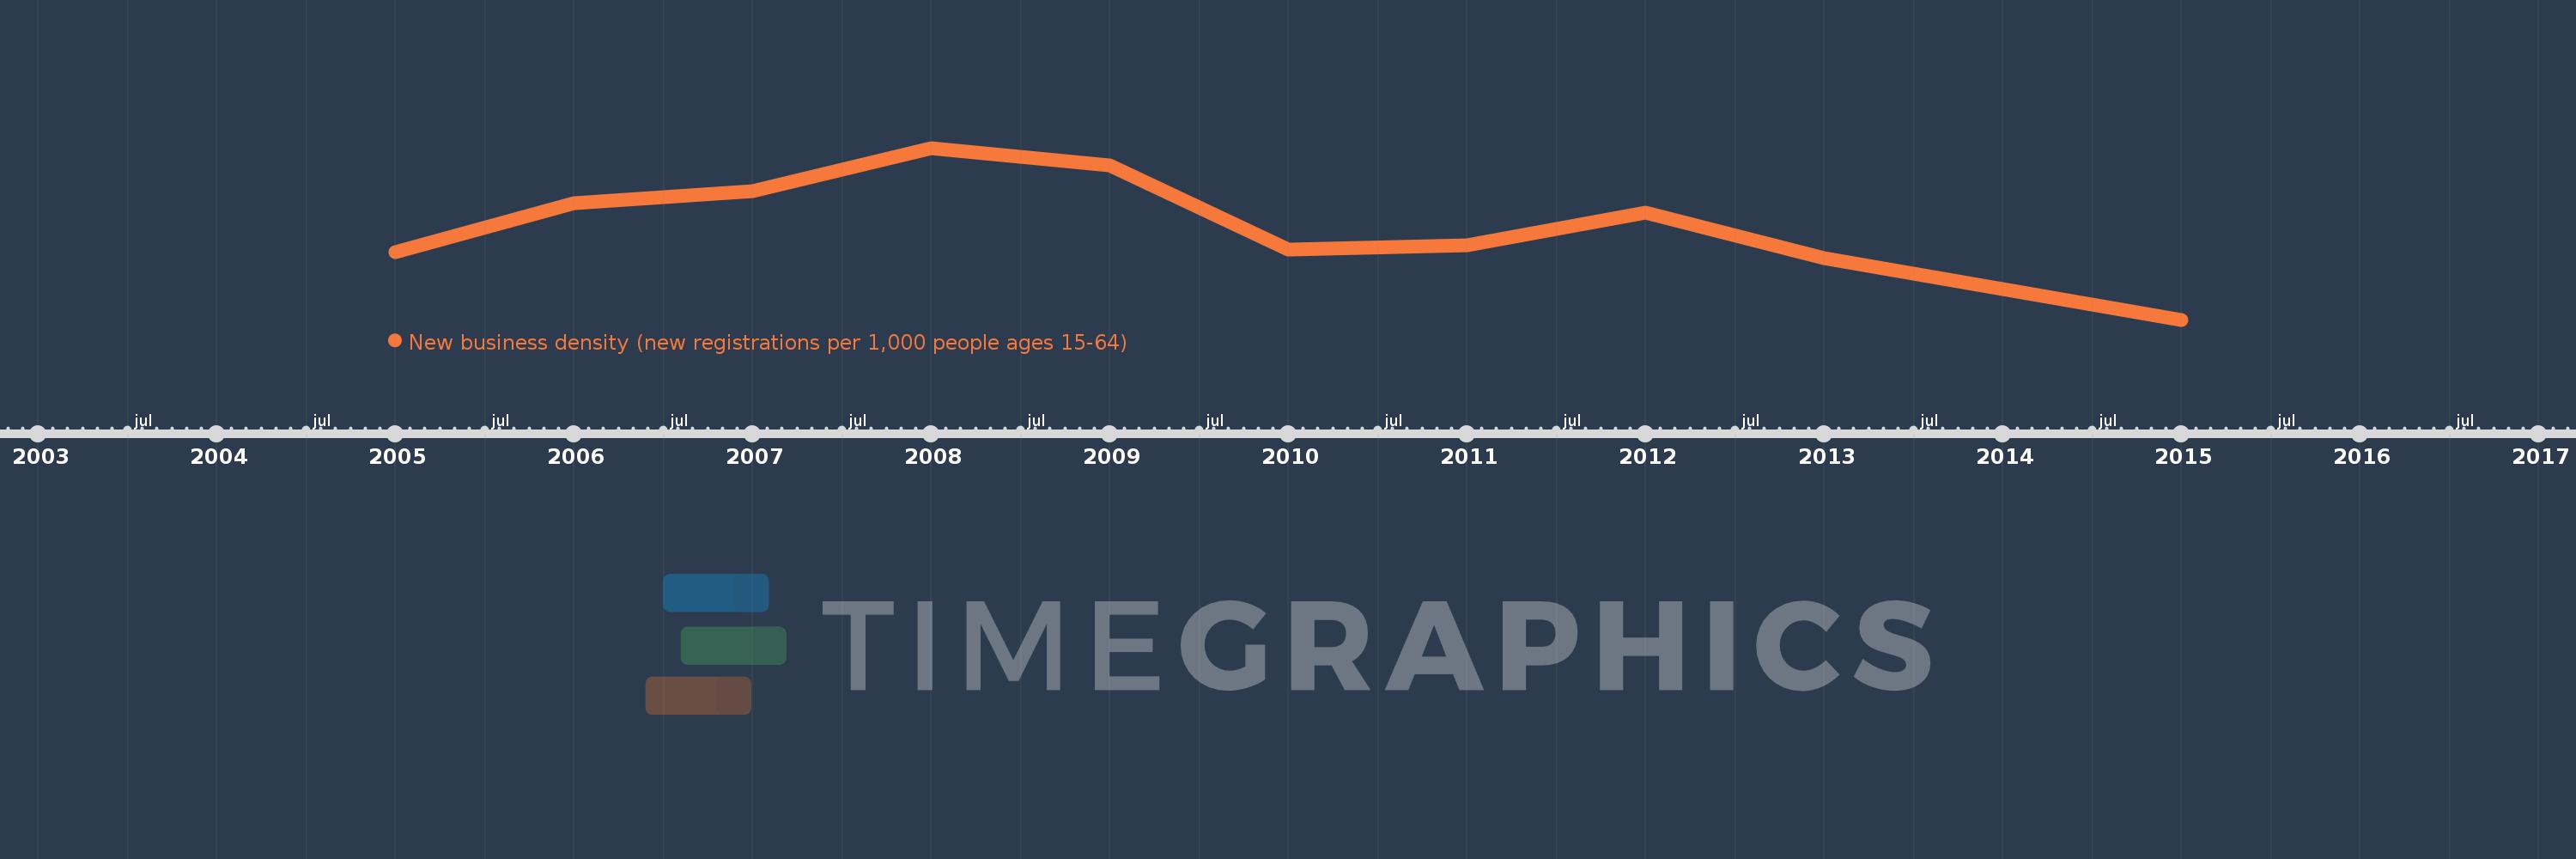
This timeline shows a graph from 2005 to 2015 of Latin America & the Caribbean (IDA & IBRD countries). No data until 2004. Number of actual observations by date: 10.
Source name:
World Development Indicators
Source organization:
World Bank's Entrepreneurship Survey and database (http://econ.worldbank.org/research/entrepreneurship).
Categories, topics:
Private Sector
Last updated:
apr 23, 2017
Indicators value changes by year
Meaning:
2.888
Minimum:
1.978
jan 1, 2015
Maximum:
3.621
jan 1, 2008
At the date of observation
Value
Absolute change
Change from the previous value
jan 1, 2005
2.623
+2.623
0.0%
jan 1, 2006
3.089
+0.466
17.76%
jan 1, 2007
3.204
+0.116
3.74%
jan 1, 2008
3.621
+0.416
12.99%
jan 1, 2009
3.452
-0.169
-4.67%
jan 1, 2010
2.647
-0.805
-23.33%
jan 1, 2011
2.694
+0.048
1.81%
jan 1, 2012
2.999
+0.305
11.31%
jan 1, 2013
2.57
-0.429
-14.31%
jan 1, 2015
1.978
-0.592
-23.03%
Ranking of countries by current statistics by years
