29
/
en
AIzaSyAYiBZKx7MnpbEhh9jyipgxe19OcubqV5w
April 1, 2024
51242
Middle income
MIC
false
2
1
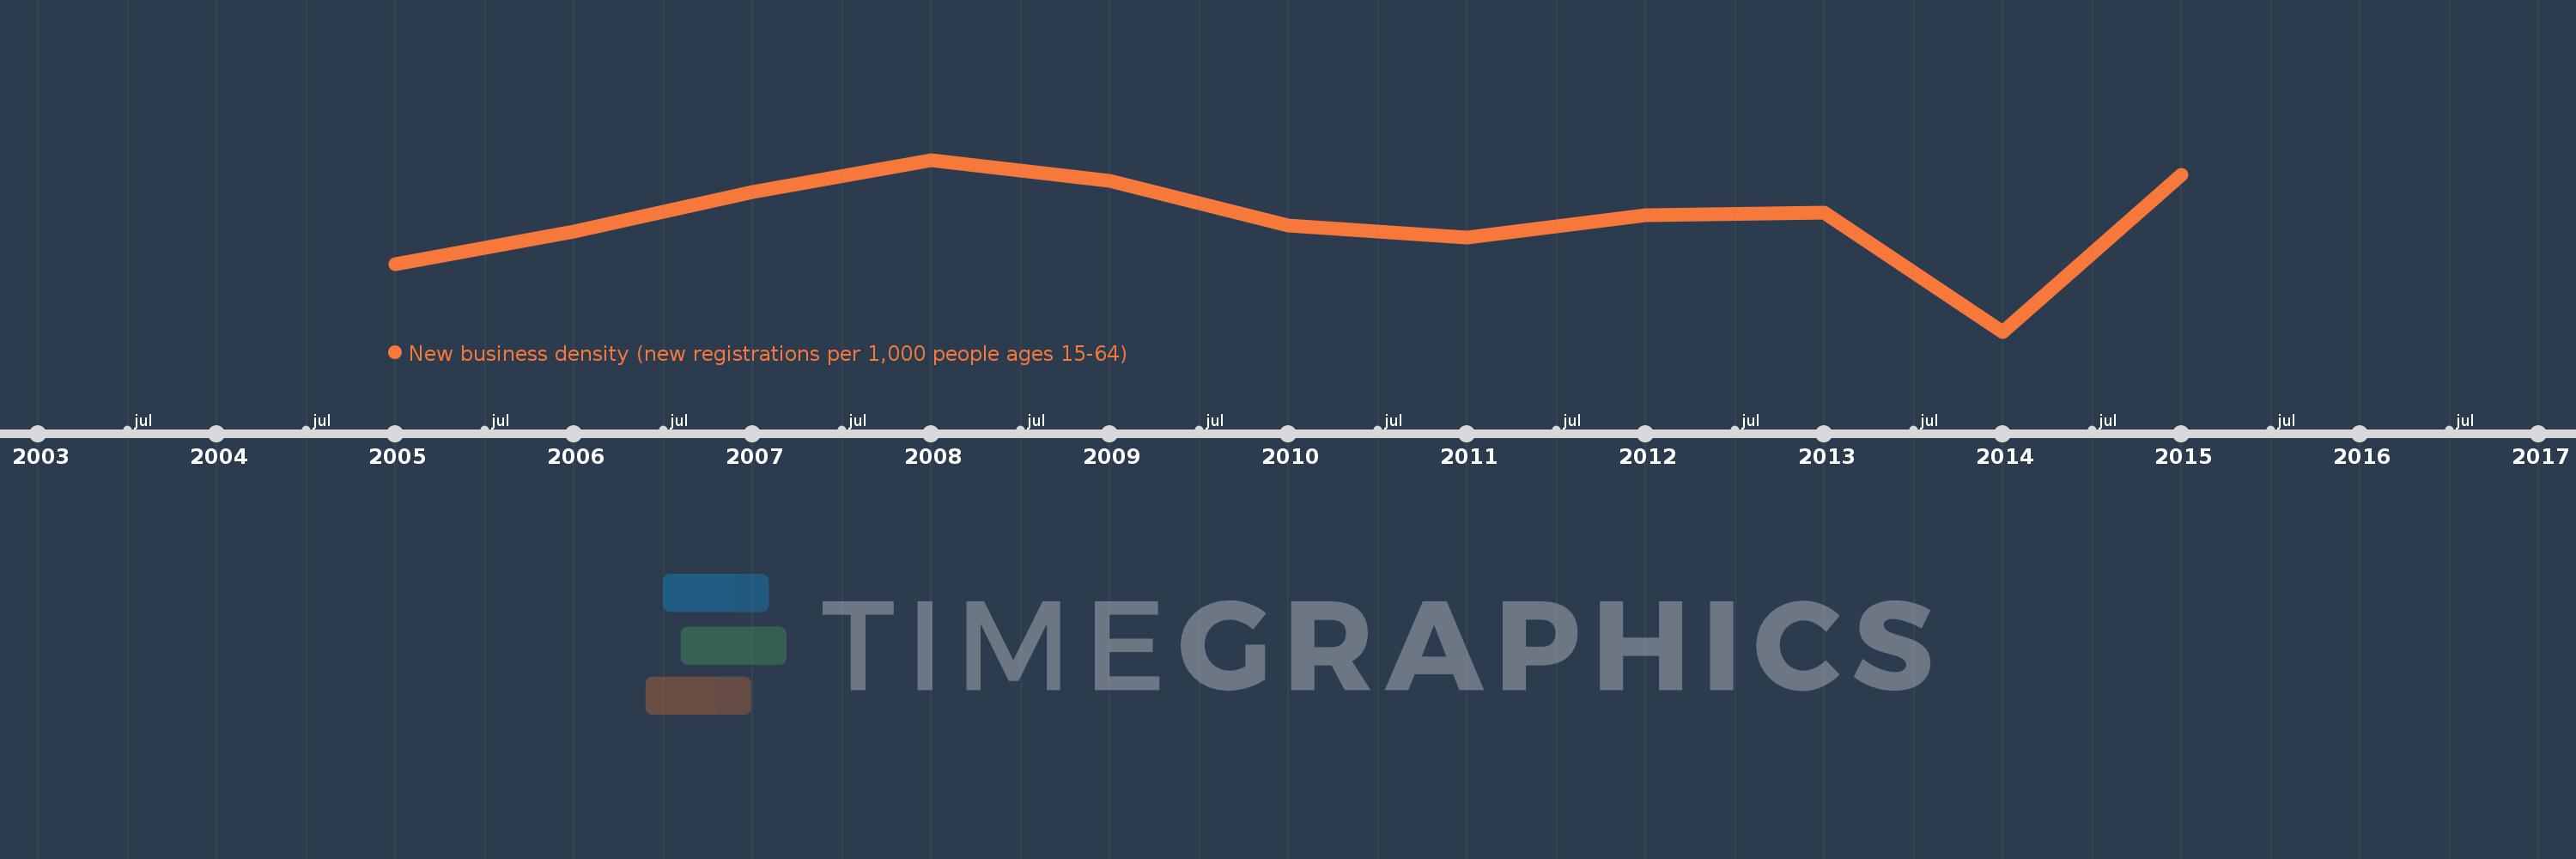
New business density (new registrations per 1,000 people ages 15-64)
2015,2014,2013,2012,2011,2010,2009,2008,2007,2006,2005
This statistics in other country:
Timeline:
This timeline shows a graph from 2005 to 2015 of Middle income. No data until 2004. Number of actual observations by date: 11.
Source name:
World Development Indicators
Source organization:
World Bank's Entrepreneurship Survey and database (http://econ.worldbank.org/research/entrepreneurship).
Categories, topics:
Private Sector
Last updated:
apr 23, 2017
Indicators value changes by year
At the date of observation
Value
Absolute change
Change from previous value
jan 1, 2005
1.811
+1.811
0.0%
jan 1, 2006
2.045
+0.234
12.93%
jan 1, 2007
2.333
+0.288
14.07%
jan 1, 2008
2.571
+0.238
10.2%
jan 1, 2009
2.417
-0.154
-5.99%
jan 1, 2010
2.092
-0.325
-13.46%
jan 1, 2011
2.003
-0.088
-4.23%
jan 1, 2012
2.163
+0.159
7.96%
jan 1, 2013
2.185
+0.022
1.02%
jan 1, 2014
1.315
-0.87
-39.81%
jan 1, 2015
2.459
+1.144
87.0%
Ranking of countries by current statistics by years


Comments: