29
/
en
AIzaSyAYiBZKx7MnpbEhh9jyipgxe19OcubqV5w
April 1, 2024
149506
Haiti
HTI
true
2
1
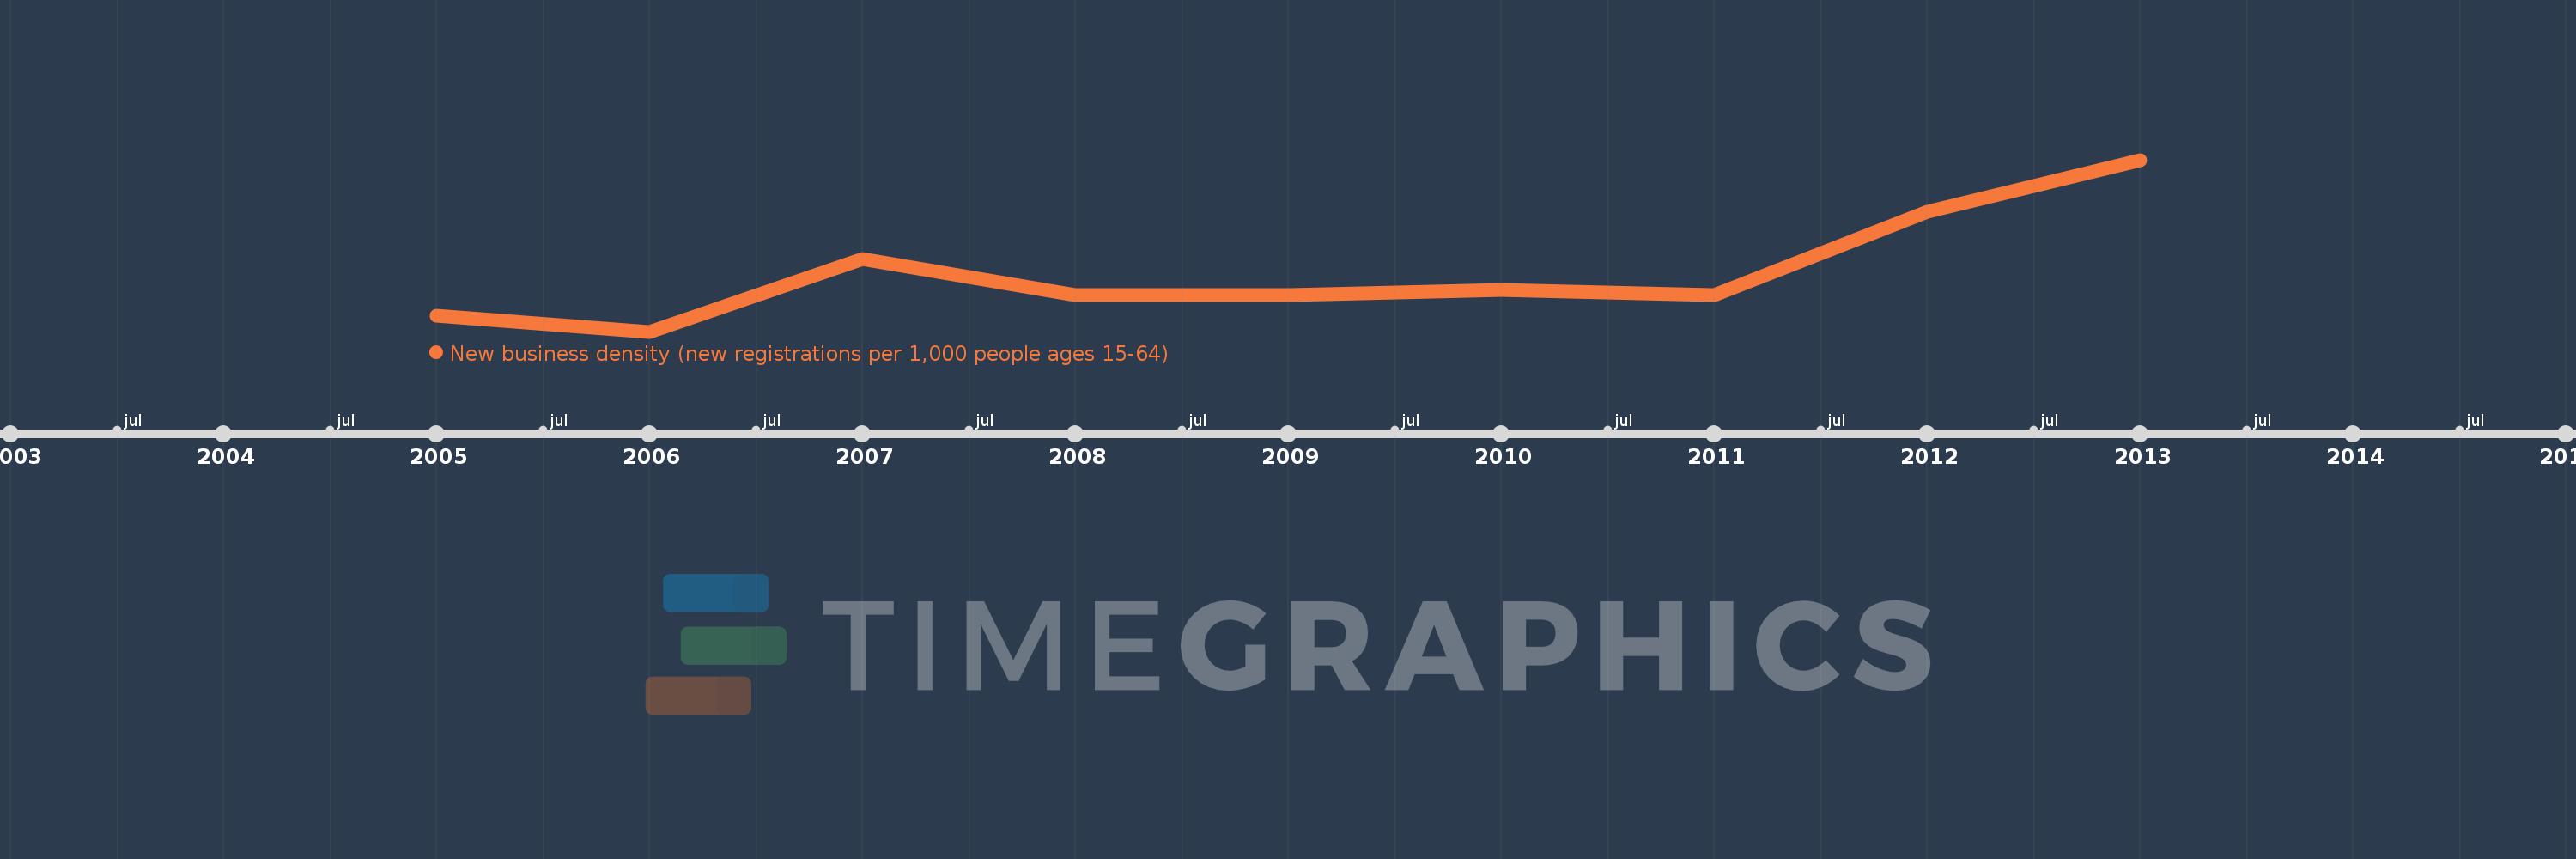
New business density (new registrations per 1,000 people ages 15-64)
2013,2012,2011,2010,2009,2008,2007,2006,2005
This statistics in other country:
Timeline:
This timeline shows a graph from 2005 to 2013 of Haiti. No data until 2004. Number of actual observations by date: 9.
Source name:
World Development Indicators
Source organization:
World Bank's Entrepreneurship Survey and database (http://econ.worldbank.org/research/entrepreneurship).
Categories, topics:
Private Sector
Last updated:
apr 23, 2017
Indicators value changes by year
At the date of observation
Value
Absolute change
Change from previous value
jan 1, 2005
0.03
+0.03
0.0%
jan 1, 2006
0.027
-0.003
-8.91%
jan 1, 2007
0.041
+0.014
51.17%
jan 1, 2008
0.034
-0.007
-16.44%
jan 1, 2009
0.034
0.0
-1.29%
jan 1, 2010
0.035
+0.001
3.85%
jan 1, 2011
0.034
-0.001
-2.87%
jan 1, 2012
0.05
+0.016
48.28%
jan 1, 2013
0.06
+0.01
19.5%
Ranking of countries by current statistics by years


Comments: