29
/
en
AIzaSyAYiBZKx7MnpbEhh9jyipgxe19OcubqV5w
April 1, 2024
237528
Serbia
SRB
true
2
1
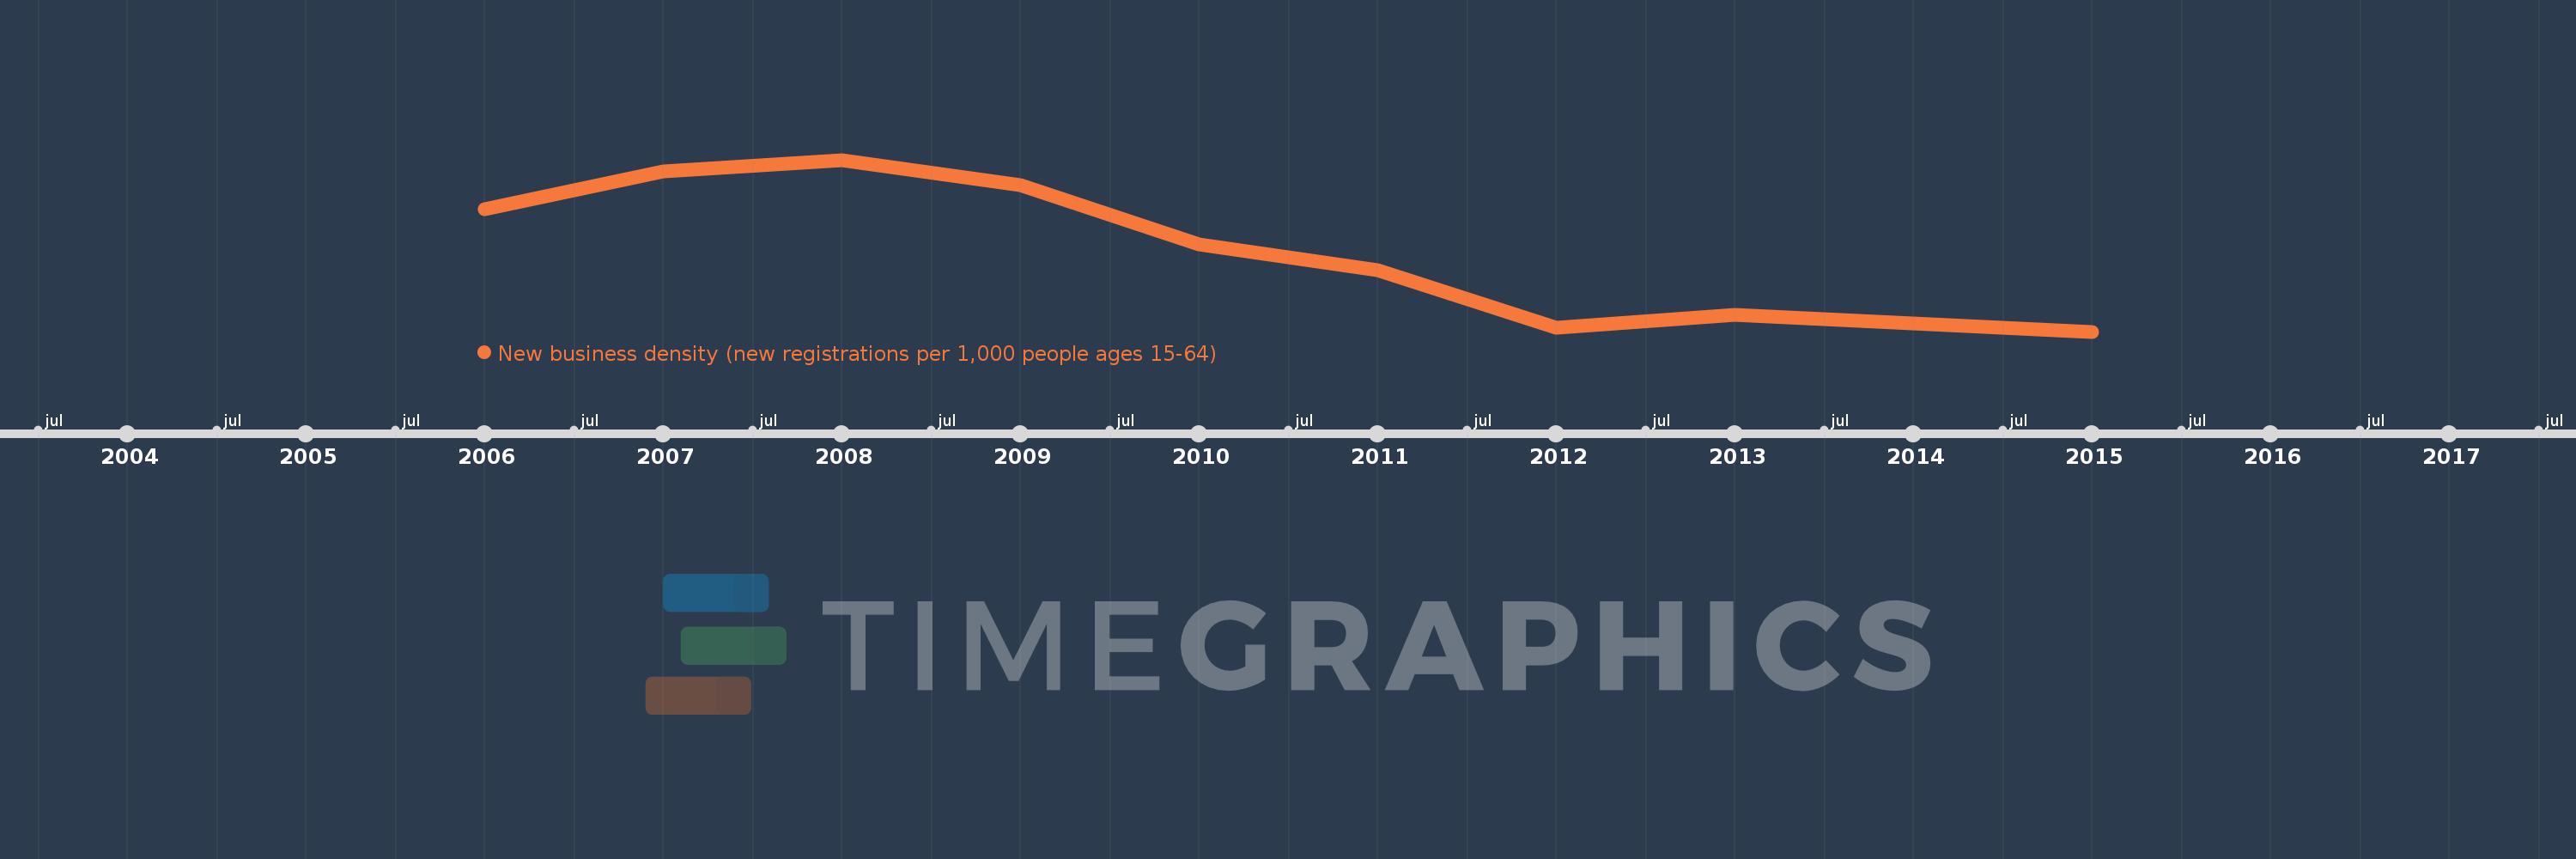
New business density (new registrations per 1,000 people ages 15-64)
2015,2013,2012,2011,2010,2009,2008,2007,2006
This statistics in other country:
Timeline:
This timeline shows a graph from 2006 to 2015 of Serbia. No data until 2005. Number of actual observations by date: 9.
Source name:
World Development Indicators
Source organization:
World Bank's Entrepreneurship Survey and database (http://econ.worldbank.org/research/entrepreneurship).
Categories, topics:
Private Sector
Last updated:
apr 23, 2017
Indicators value changes by year
At the date of observation
Value
Absolute change
Change from previous value
jan 1, 2006
2.04
+2.04
0.0%
jan 1, 2007
2.168
+0.128
6.27%
jan 1, 2008
2.208
+0.04
1.83%
jan 1, 2009
2.122
-0.086
-3.88%
jan 1, 2010
1.918
-0.204
-9.62%
jan 1, 2011
1.83
-0.088
-4.58%
jan 1, 2012
1.633
-0.197
-10.76%
jan 1, 2013
1.677
+0.043
2.66%
jan 1, 2015
1.62
-0.057
-3.38%
Ranking of countries by current statistics by years


Comments: