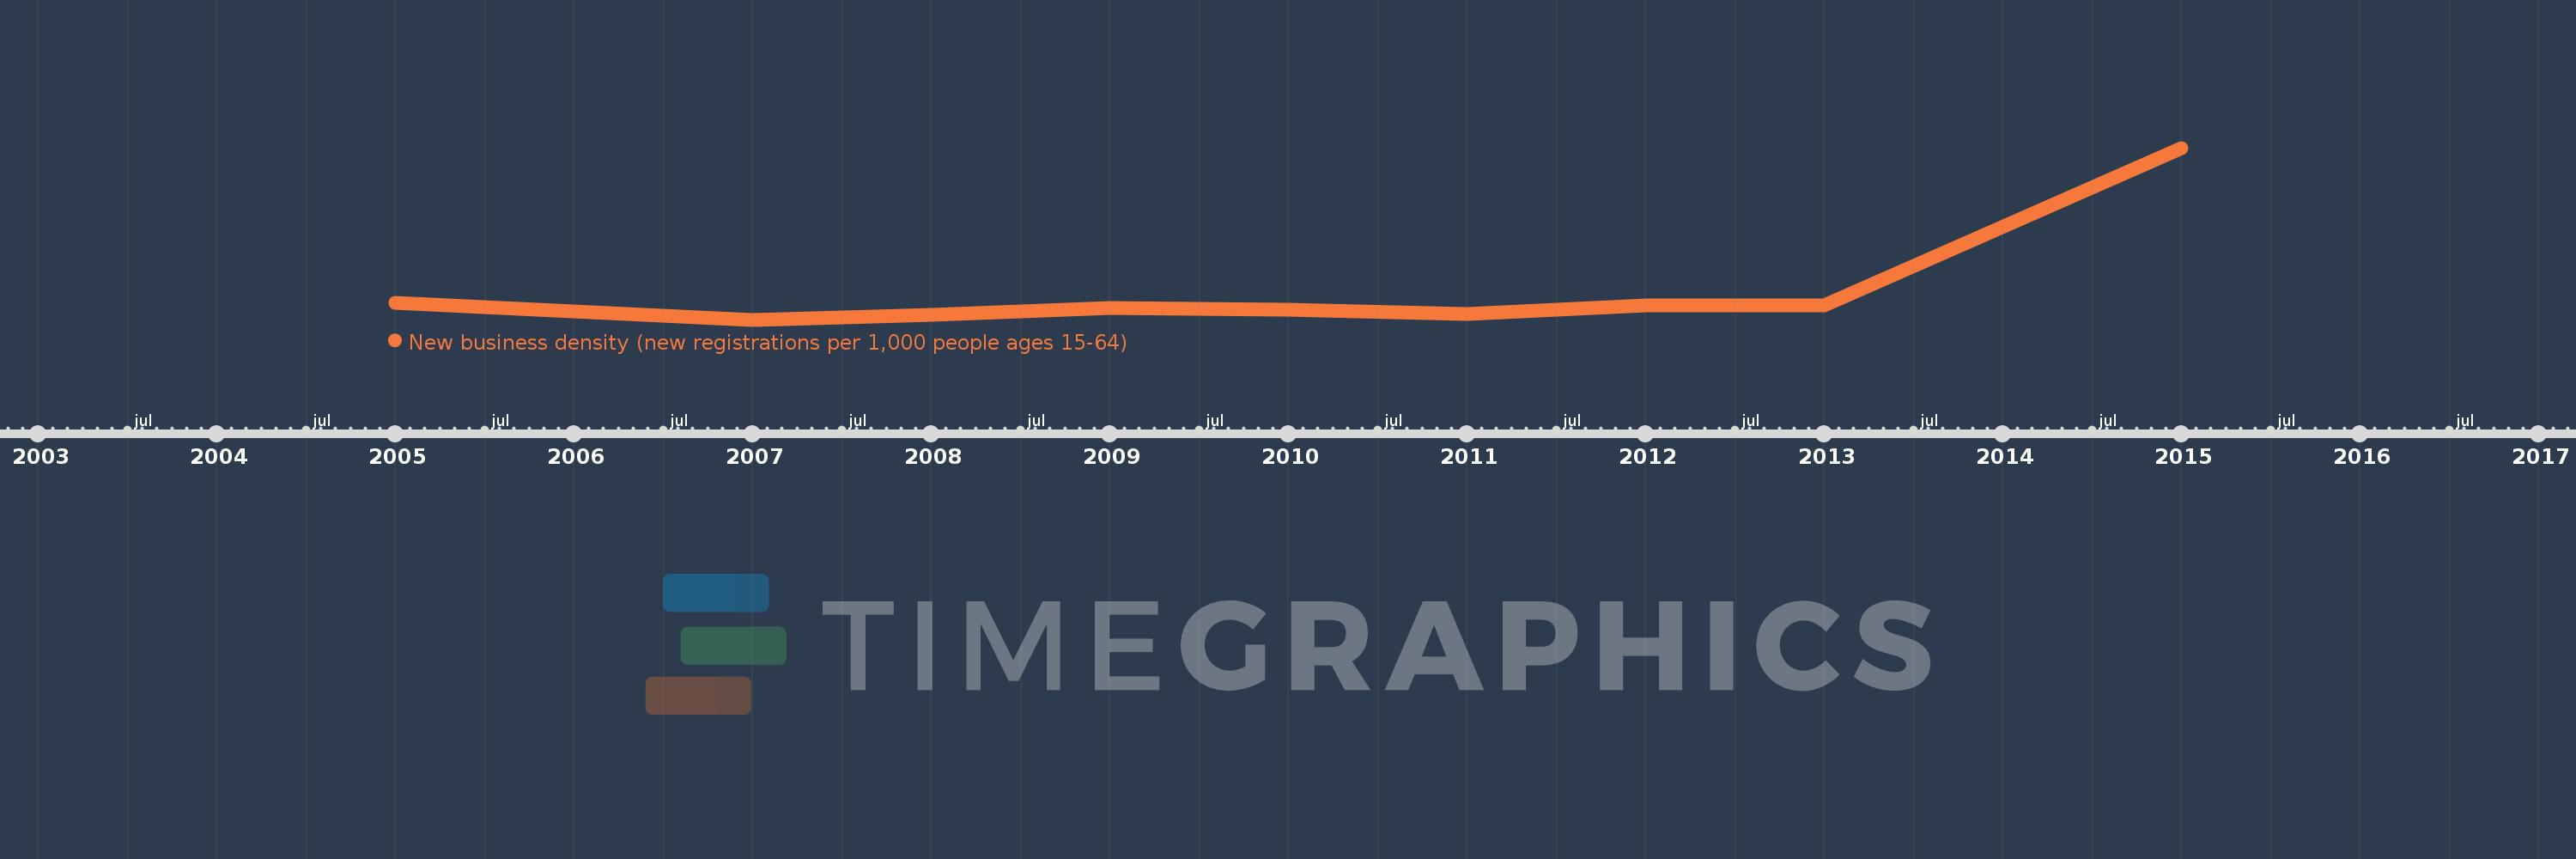
This timeline shows a graph from 2005 to 2015 of Fragile and conflict affected situations. No data until 2004. Number of actual observations by date: 10.
Source name:
World Development Indicators
Source organization:
World Bank's Entrepreneurship Survey and database (http://econ.worldbank.org/research/entrepreneurship).
Categories, topics:
Private Sector
Last updated:
apr 23, 2017
Indicators value changes by year
Meaning:
0.345
Minimum:
0.173
jan 1, 2007
Maximum:
1.32
jan 1, 2015
At the date of observation
Value
Absolute change
Change from the previous value
jan 1, 2005
0.288
+0.288
0.0%
jan 1, 2006
0.228
-0.06
-20.87%
jan 1, 2007
0.173
-0.055
-24.13%
jan 1, 2008
0.206
+0.033
18.98%
jan 1, 2009
0.249
+0.043
20.99%
jan 1, 2010
0.24
-0.01
-3.82%
jan 1, 2011
0.214
-0.026
-10.76%
jan 1, 2012
0.266
+0.052
24.45%
jan 1, 2013
0.268
+0.002
0.66%
jan 1, 2015
1.32
+1.052
392.86%
Ranking of countries by current statistics by years
