29
/
en
AIzaSyAYiBZKx7MnpbEhh9jyipgxe19OcubqV5w
April 1, 2024
29373
East Asia & Pacific (IDA & IBRD countries)
TEA
false
2
1
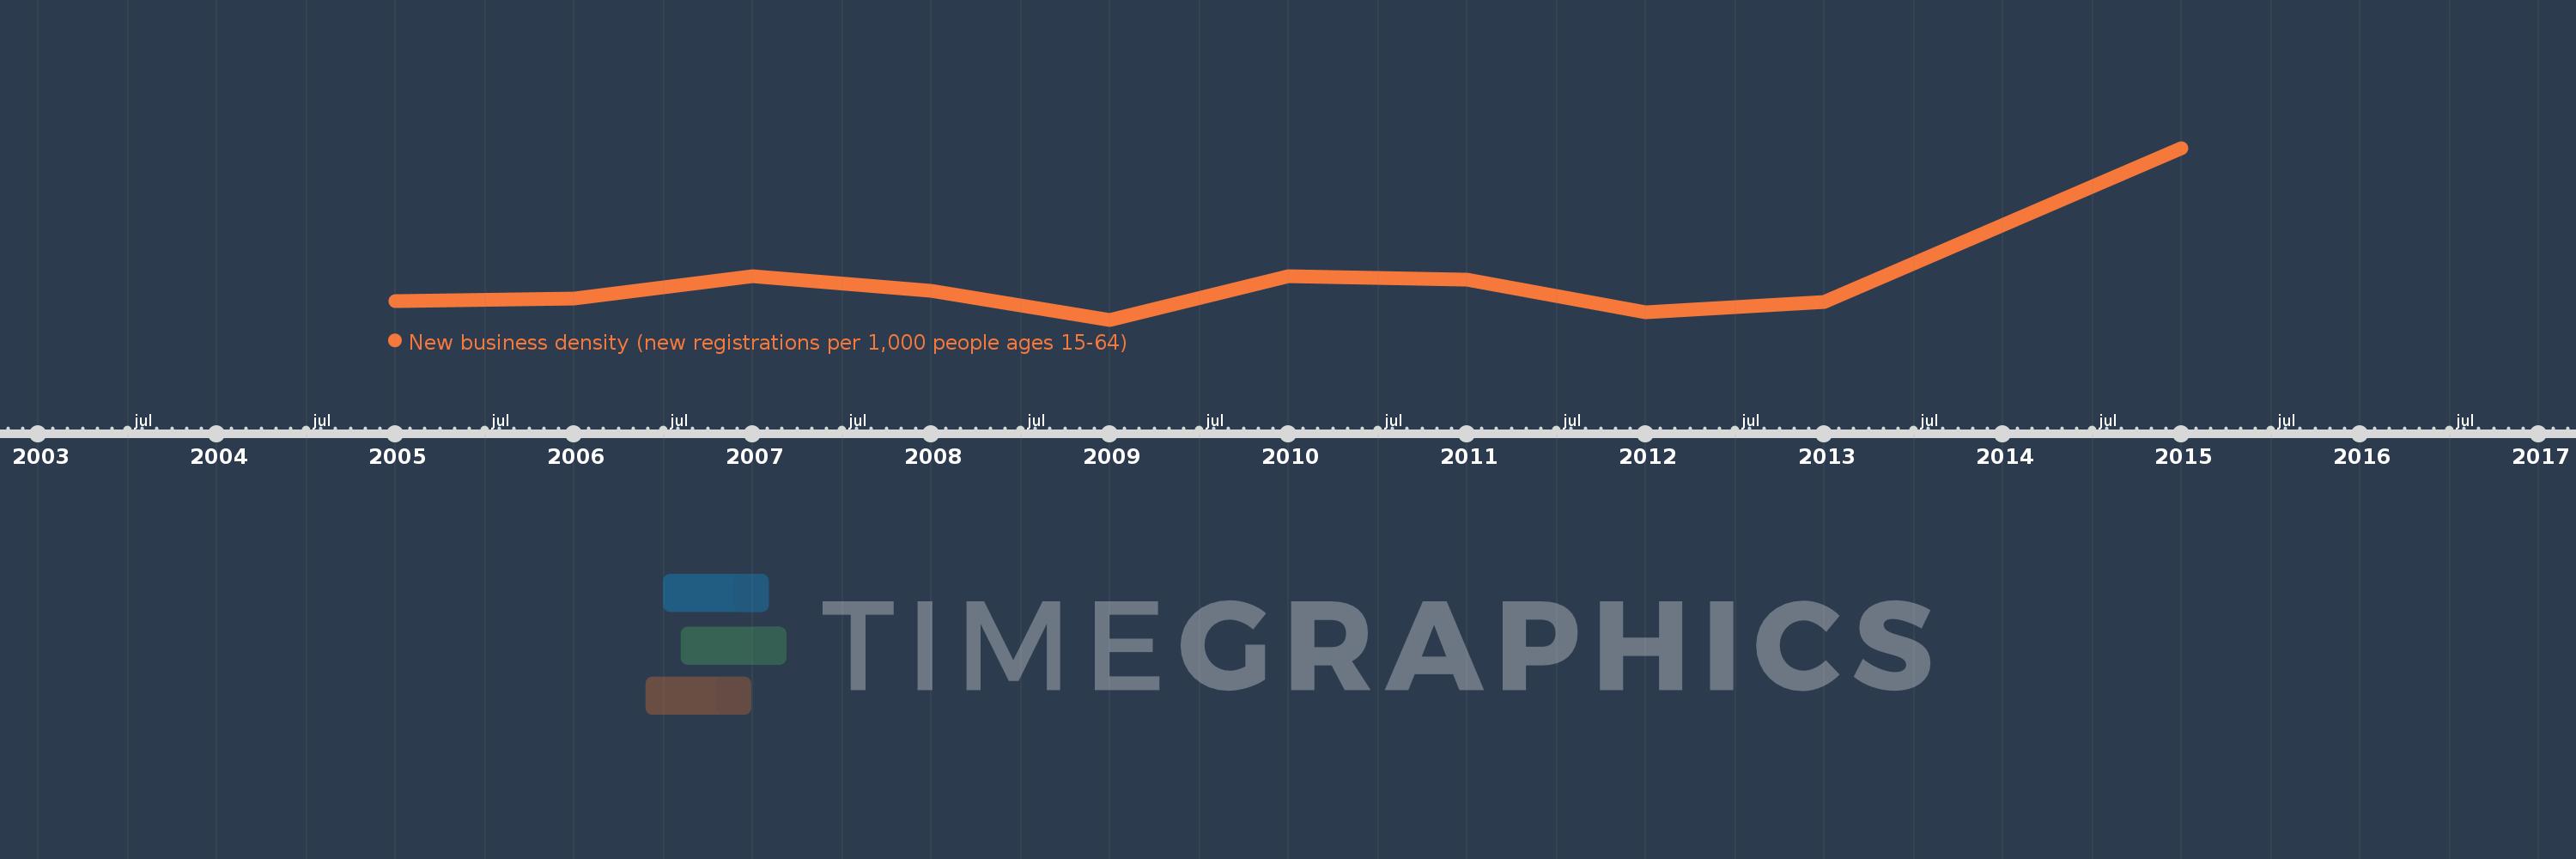
New business density (new registrations per 1,000 people ages 15-64)
2015,2013,2012,2011,2010,2009,2008,2007,2006,2005
This statistics in other country:
Timeline:
This timeline shows a graph from 2005 to 2015 of East Asia & Pacific (IDA & IBRD countries). No data until 2004. Number of actual observations by date: 10.
Source name:
World Development Indicators
Source organization:
World Bank's Entrepreneurship Survey and database (http://econ.worldbank.org/research/entrepreneurship).
Categories, topics:
Private Sector
Last updated:
apr 23, 2017
Indicators value changes by year
At the date of observation
Value
Absolute change
Change from previous value
jan 1, 2005
1.357
+1.357
0.0%
jan 1, 2006
1.392
+0.034
2.53%
jan 1, 2007
1.716
+0.324
23.29%
jan 1, 2008
1.498
-0.218
-12.69%
jan 1, 2009
1.086
-0.412
-27.52%
jan 1, 2010
1.706
+0.62
57.11%
jan 1, 2011
1.666
-0.039
-2.31%
jan 1, 2012
1.19
-0.477
-28.61%
jan 1, 2013
1.344
+0.154
12.95%
jan 1, 2015
3.553
+2.209
164.38%
Ranking of countries by current statistics by years


Comments: