29
/
en
AIzaSyAYiBZKx7MnpbEhh9jyipgxe19OcubqV5w
April 1, 2024
224004
Philippines
PHL
true
2
1
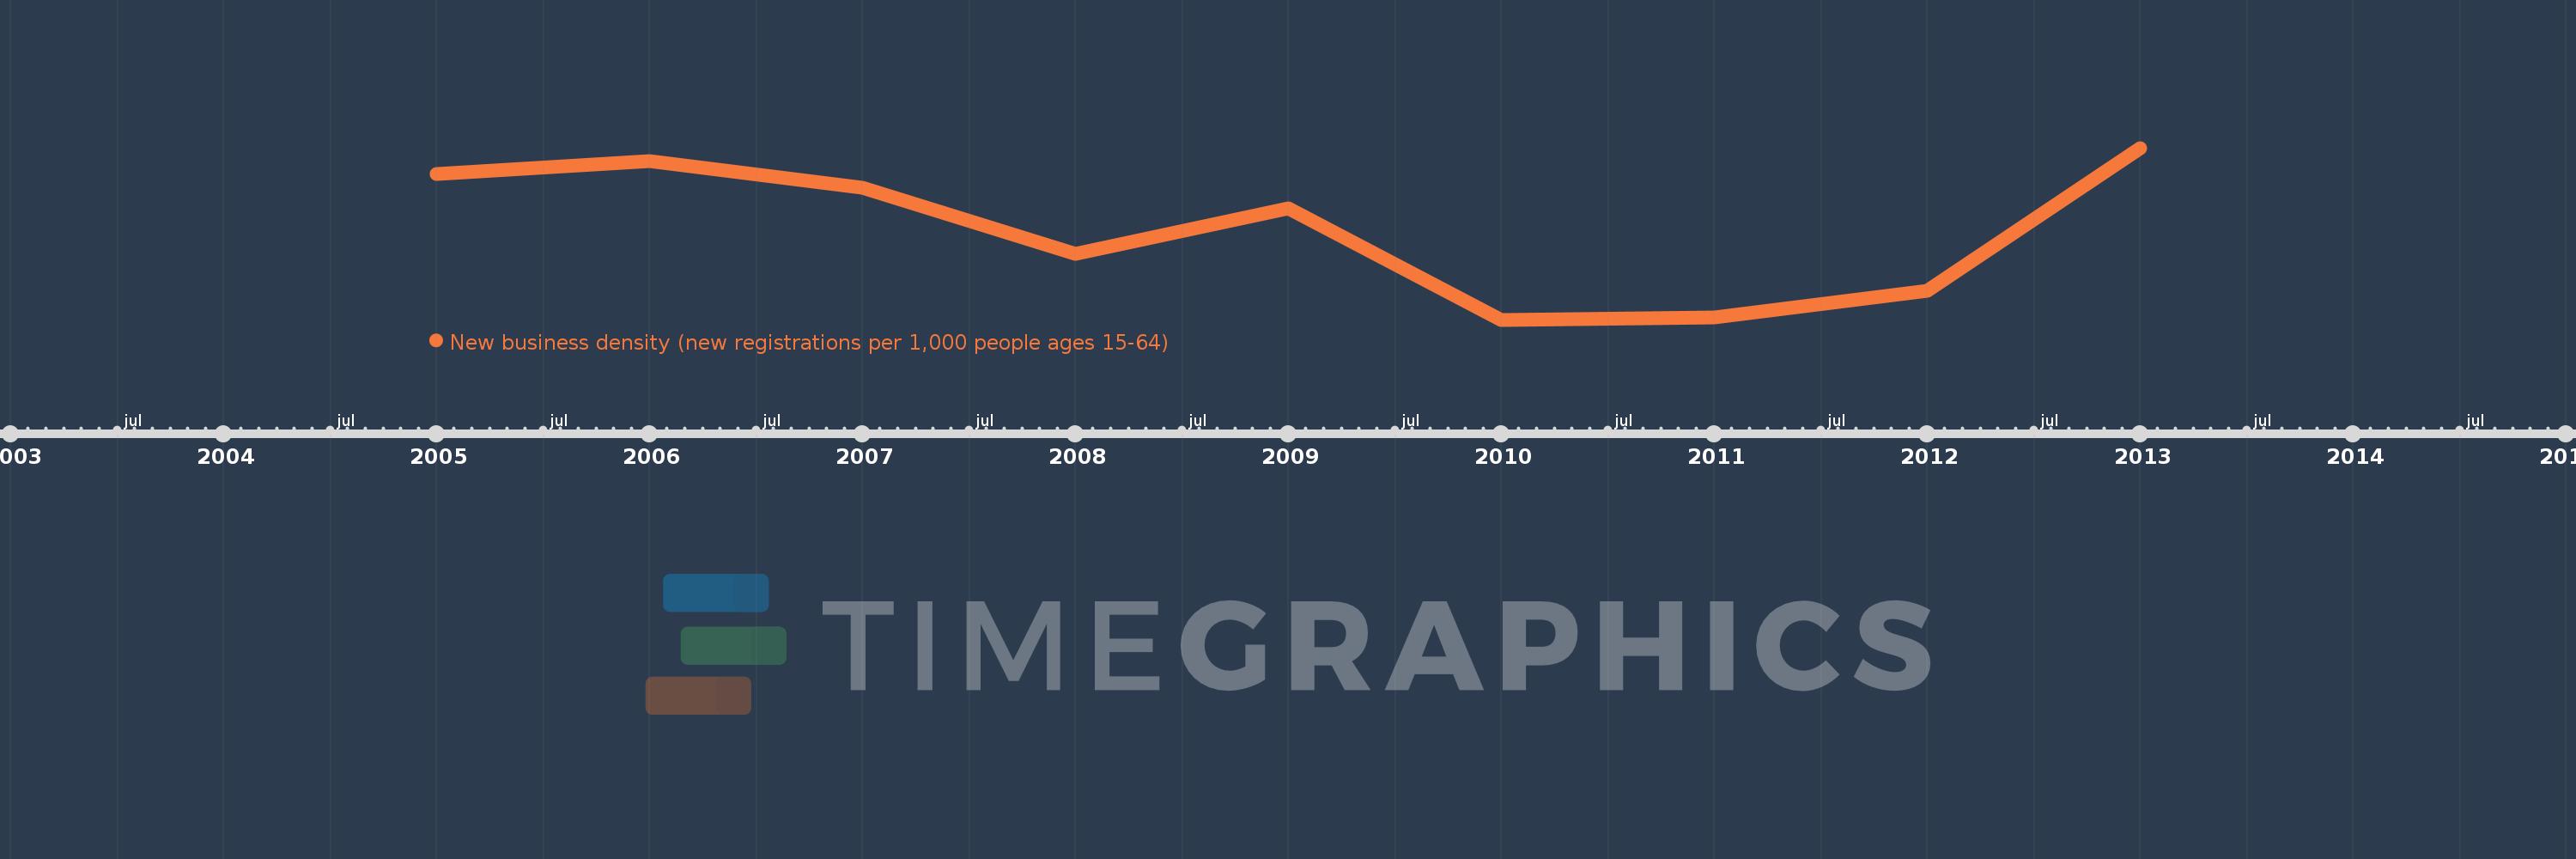
New business density (new registrations per 1,000 people ages 15-64)
2013,2012,2011,2010,2009,2008,2007,2006,2005
This statistics in other country:
Timeline:
This timeline shows a graph from 2005 to 2013 of Philippines. No data until 2004. Number of actual observations by date: 9.
Source name:
World Development Indicators
Source organization:
World Bank's Entrepreneurship Survey and database (http://econ.worldbank.org/research/entrepreneurship).
Categories, topics:
Private Sector
Last updated:
apr 23, 2017
Indicators value changes by year
At the date of observation
Value
Absolute change
Change from previous value
jan 1, 2005
0.26
+0.26
0.0%
jan 1, 2006
0.265
+0.005
2.01%
jan 1, 2007
0.255
-0.01
-3.66%
jan 1, 2008
0.23
-0.025
-9.81%
jan 1, 2009
0.247
+0.017
7.29%
jan 1, 2010
0.205
-0.042
-16.93%
jan 1, 2011
0.206
+0.0
0.21%
jan 1, 2012
0.216
+0.011
5.11%
jan 1, 2013
0.27
+0.054
25.0%
Ranking of countries by current statistics by years


Comments: