29
/
en
AIzaSyAYiBZKx7MnpbEhh9jyipgxe19OcubqV5w
April 1, 2024
25996
Central Europe and the Baltics
CEB
false
2
1
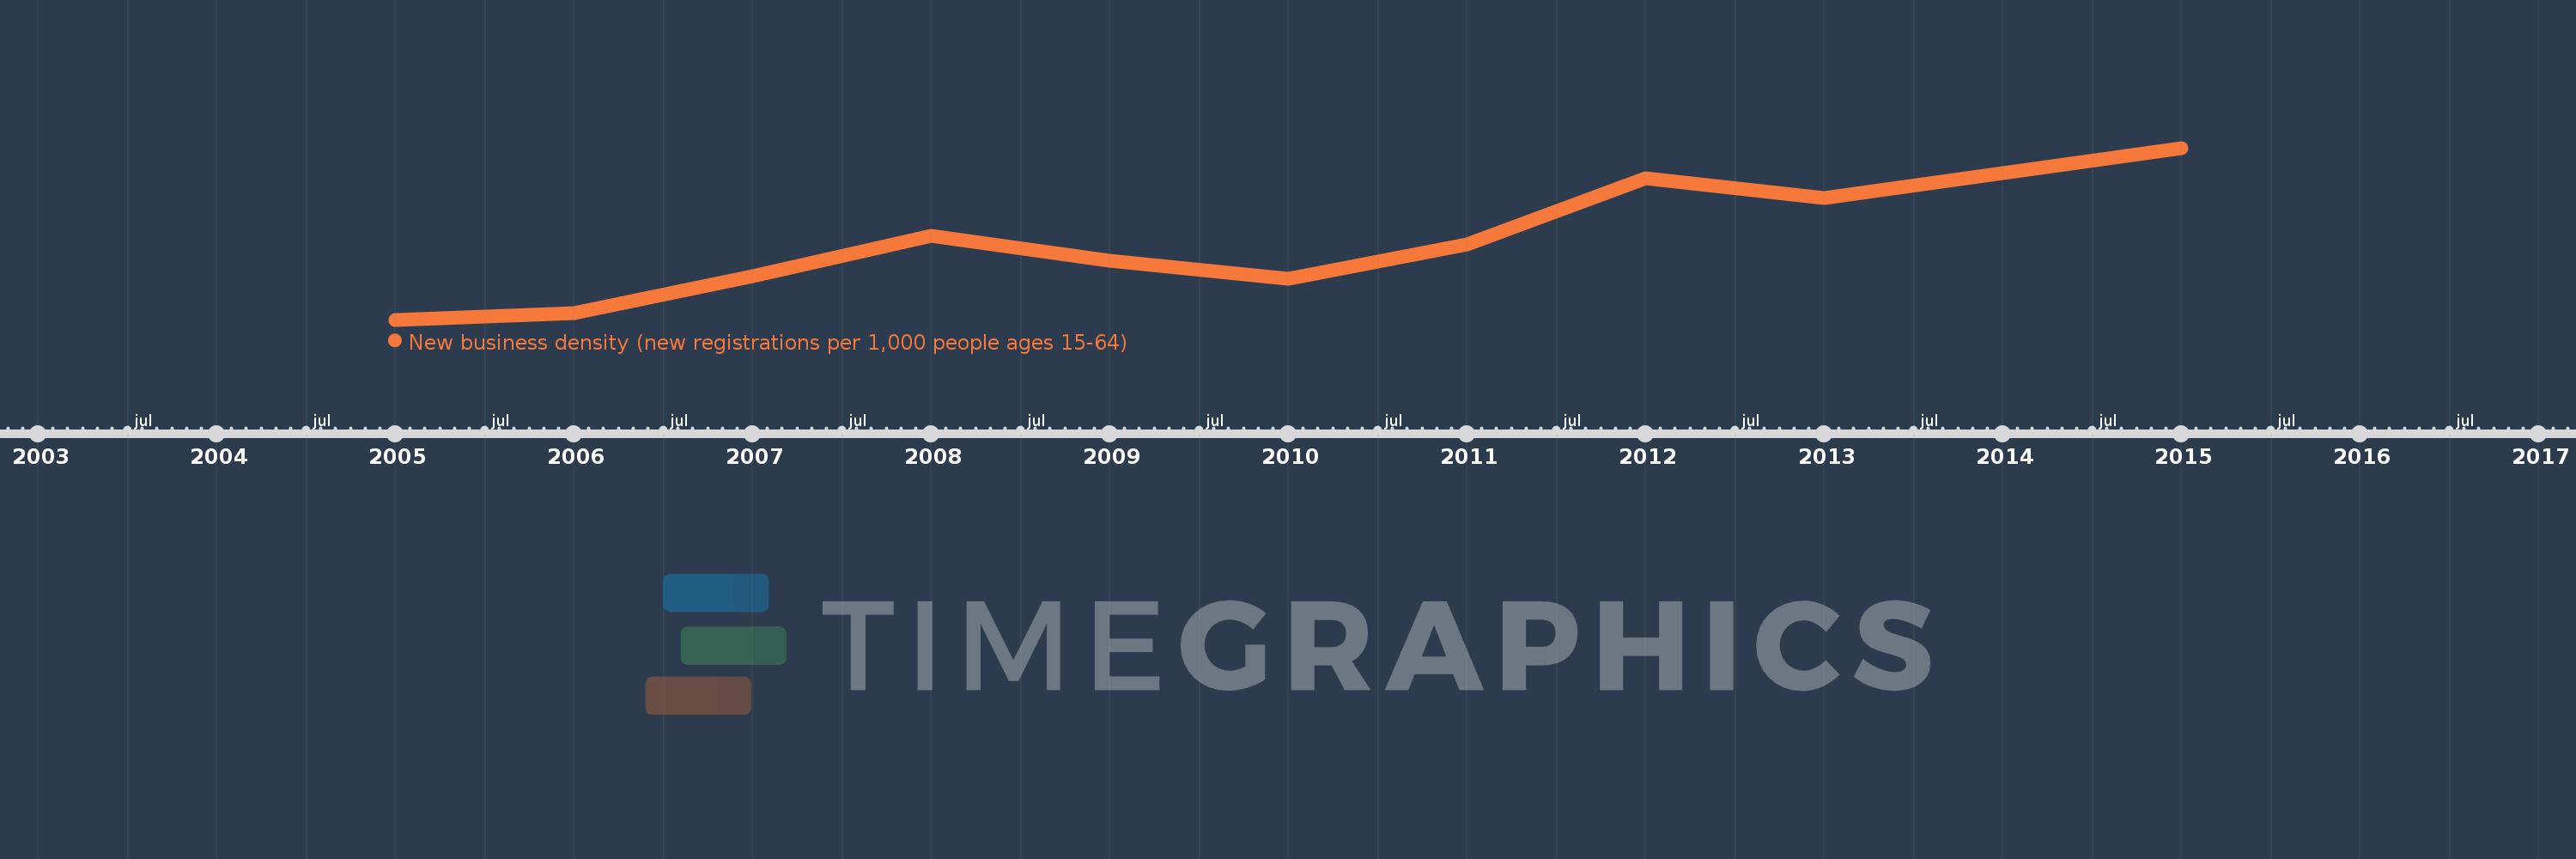
New business density (new registrations per 1,000 people ages 15-64)
2015,2013,2012,2011,2010,2009,2008,2007,2006,2005
This statistics in other country:
Timeline:
This timeline shows a graph from 2005 to 2015 of Central Europe and the Baltics. No data until 2004. Number of actual observations by date: 10.
Source name:
World Development Indicators
Source organization:
World Bank's Entrepreneurship Survey and database (http://econ.worldbank.org/research/entrepreneurship).
Categories, topics:
Private Sector
Last updated:
apr 23, 2017
Indicators value changes by year
At the date of observation
Value
Absolute change
Change from previous value
jan 1, 2005
3.529
+3.529
0.0%
jan 1, 2006
3.637
+0.107
3.04%
jan 1, 2007
4.239
+0.602
16.56%
jan 1, 2008
4.878
+0.64
15.09%
jan 1, 2009
4.487
-0.391
-8.02%
jan 1, 2010
4.187
-0.3
-6.69%
jan 1, 2011
4.752
+0.565
13.5%
jan 1, 2012
5.807
+1.055
22.2%
jan 1, 2013
5.5
-0.307
-5.29%
jan 1, 2015
6.303
+0.803
14.6%
Ranking of countries by current statistics by years


Comments: