29
/
en
AIzaSyAYiBZKx7MnpbEhh9jyipgxe19OcubqV5w
April 1, 2024
195982
Mexico
MEX
true
2
1
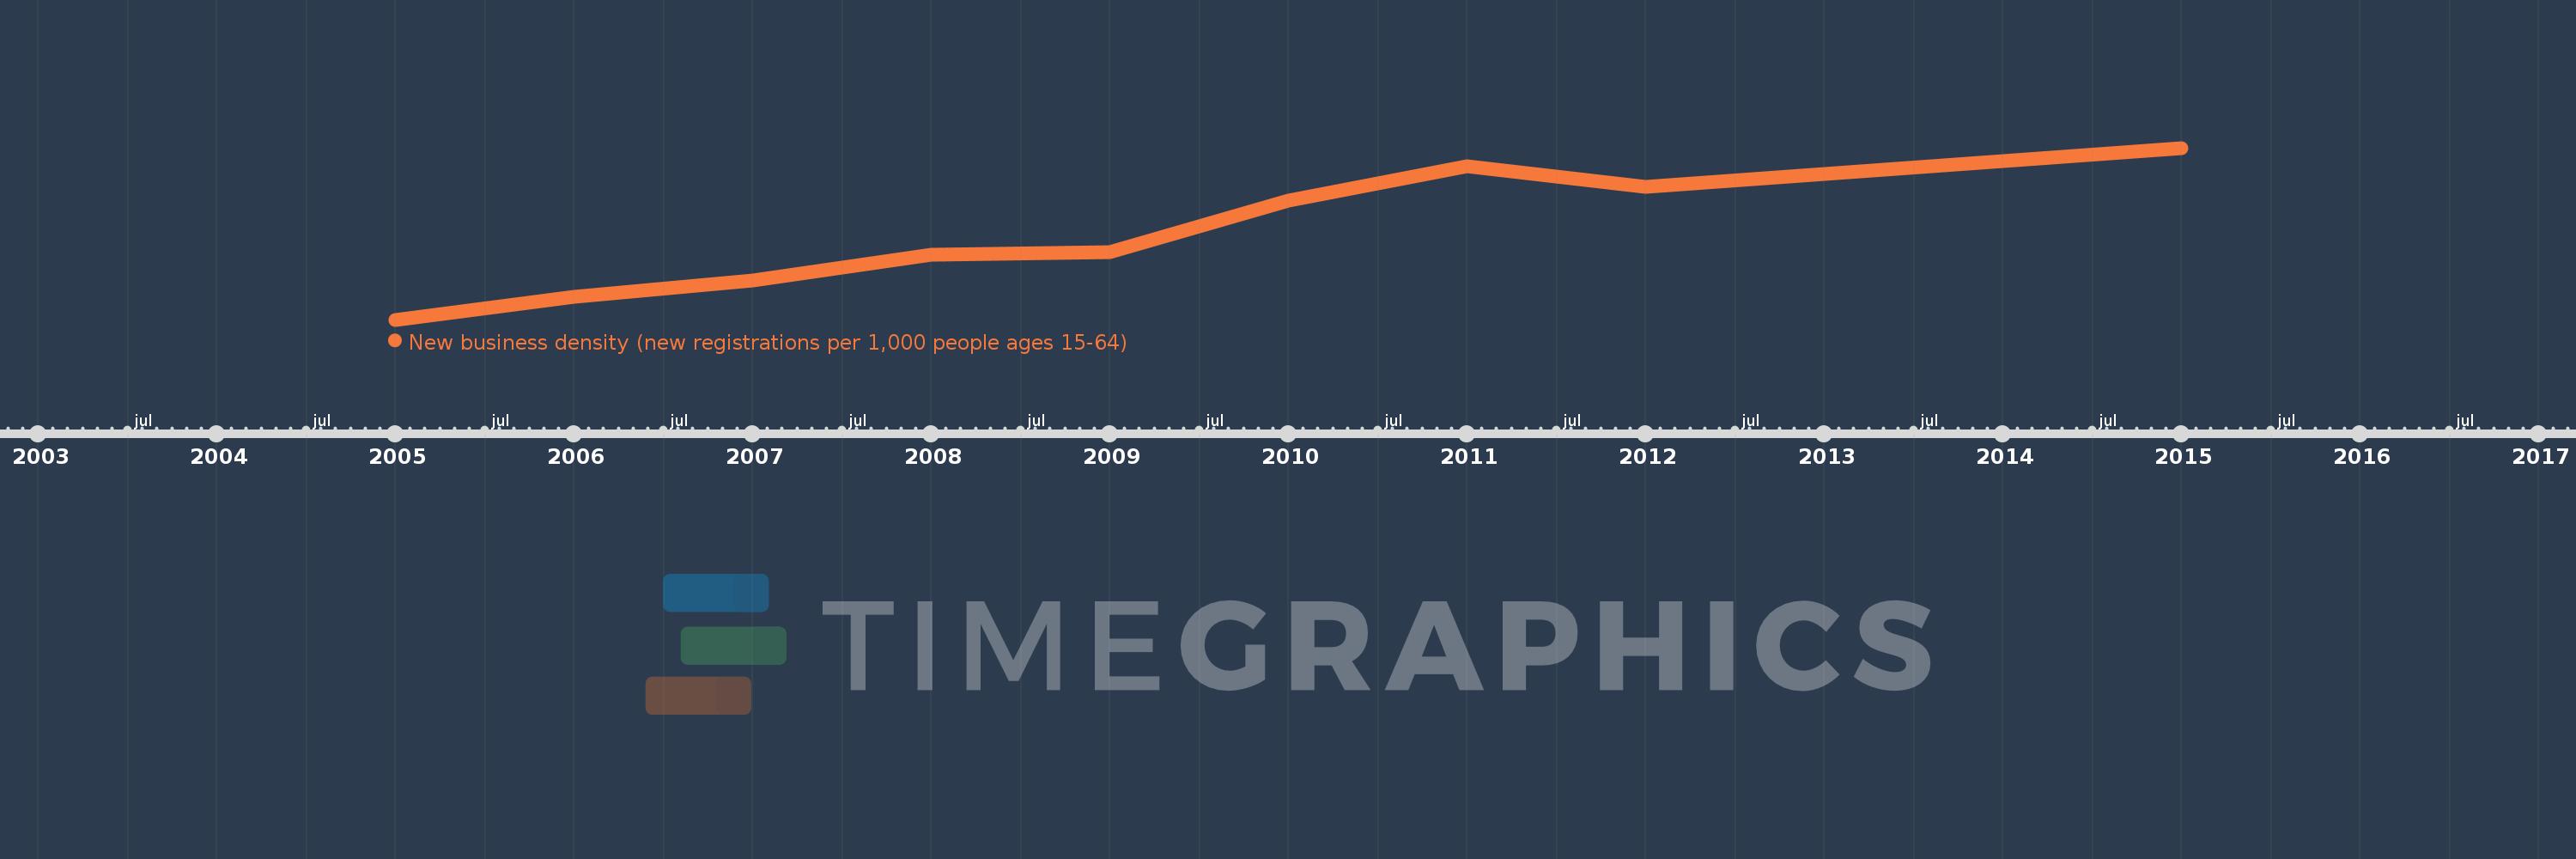
New business density (new registrations per 1,000 people ages 15-64)
2015,2013,2012,2011,2010,2009,2008,2007,2006,2005
This statistics in other country:
Timeline:
This timeline shows a graph from 2005 to 2015 of Mexico. No data until 2004. Number of actual observations by date: 10.
Source name:
World Development Indicators
Source organization:
World Bank's Entrepreneurship Survey and database (http://econ.worldbank.org/research/entrepreneurship).
Categories, topics:
Private Sector
Last updated:
apr 23, 2017
Indicators value changes by year
At the date of observation
Value
Absolute change
Change from previous value
jan 1, 2005
0.531
+0.531
0.0%
jan 1, 2006
0.585
+0.054
10.1%
jan 1, 2007
0.625
+0.04
6.82%
jan 1, 2008
0.686
+0.061
9.82%
jan 1, 2009
0.692
+0.007
0.96%
jan 1, 2010
0.815
+0.122
17.68%
jan 1, 2011
0.897
+0.082
10.09%
jan 1, 2012
0.847
-0.05
-5.62%
jan 1, 2013
0.878
+0.031
3.69%
jan 1, 2015
0.94
+0.062
7.08%
Ranking of countries by current statistics by years


Comments: