29
/
en
AIzaSyAYiBZKx7MnpbEhh9jyipgxe19OcubqV5w
April 1, 2024
44525
Least developed countries: UN classification
LDC
false
2
1
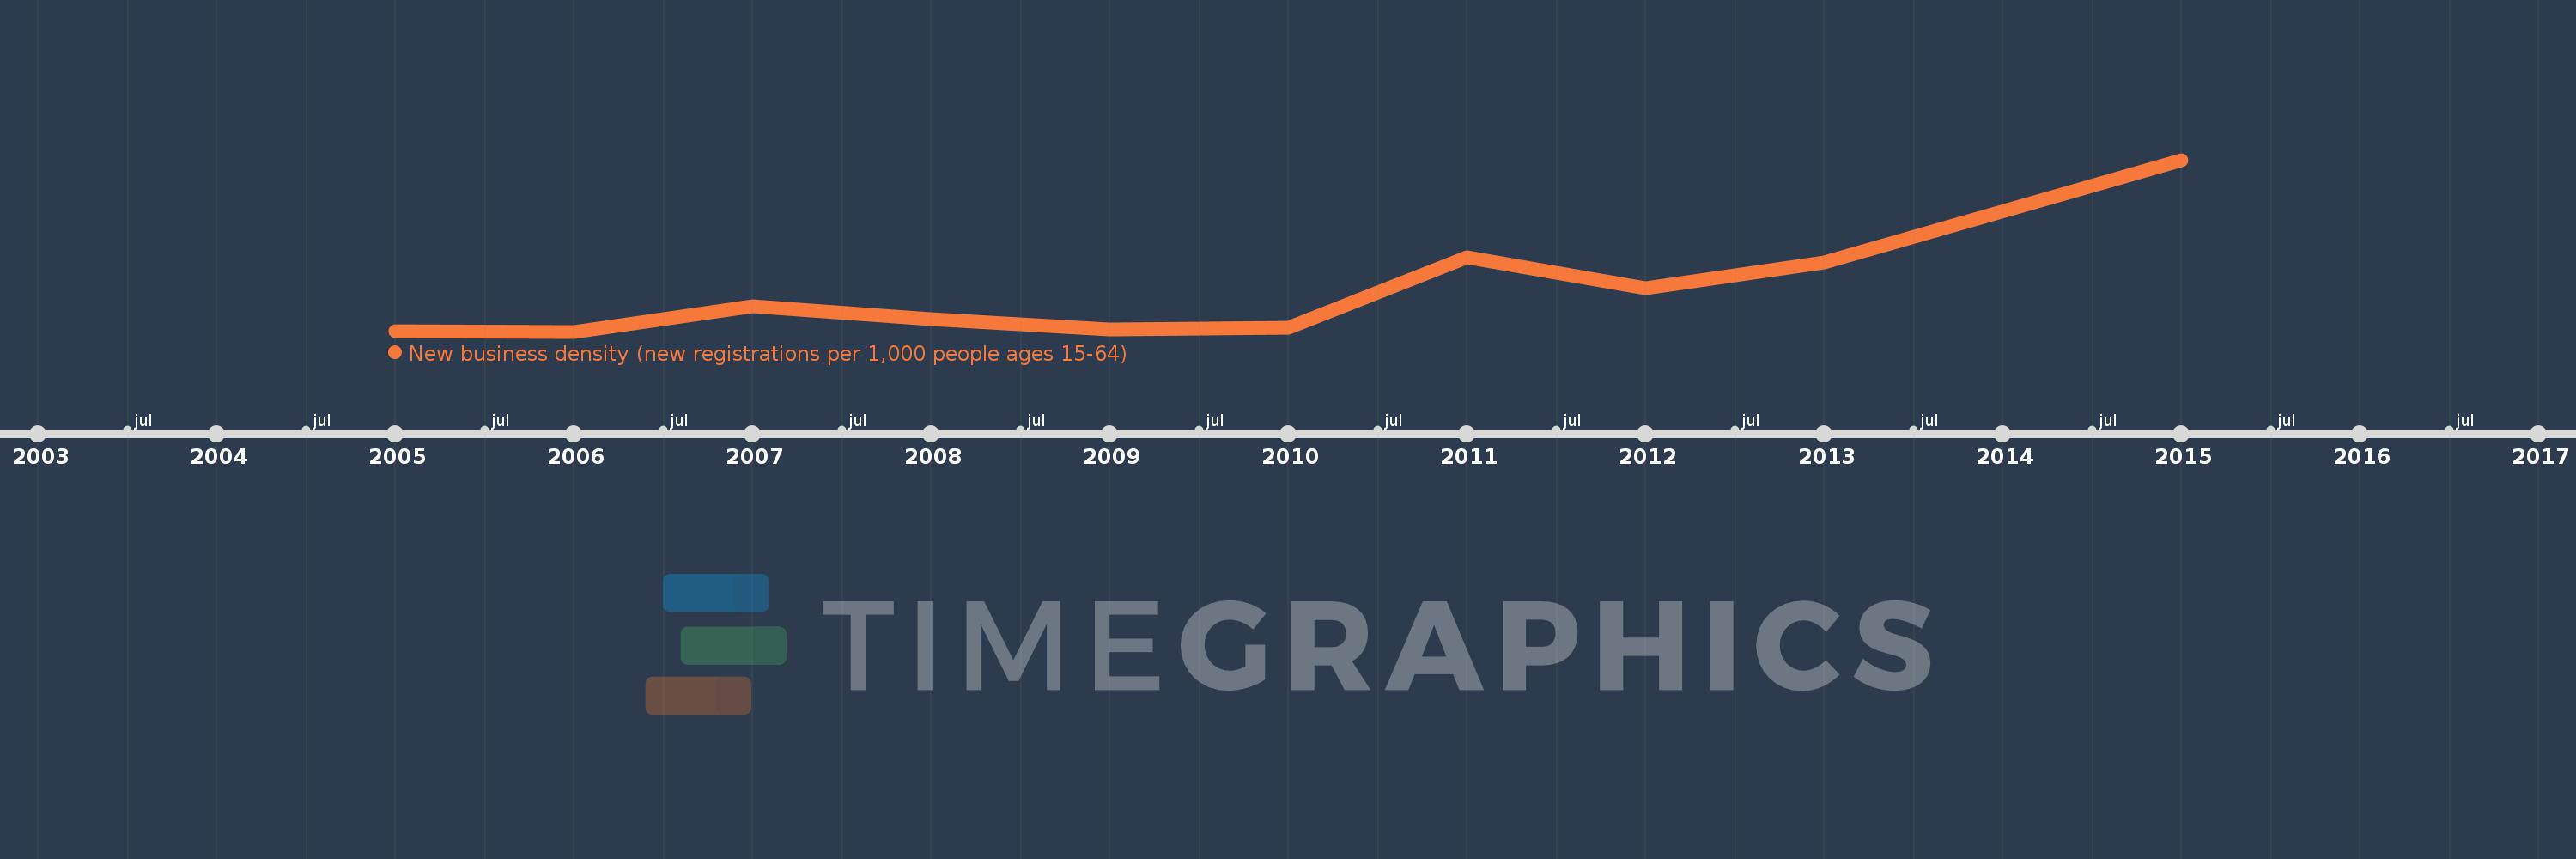
New business density (new registrations per 1,000 people ages 15-64)
2015,2013,2012,2011,2010,2009,2008,2007,2006,2005
This statistics in other country:
Timeline:
This timeline shows a graph from 2005 to 2015 of Least developed countries: UN classification. No data until 2004. Number of actual observations by date: 10.
Source name:
World Development Indicators
Source organization:
World Bank's Entrepreneurship Survey and database (http://econ.worldbank.org/research/entrepreneurship).
Categories, topics:
Private Sector
Last updated:
apr 23, 2017
Indicators value changes by year
At the date of observation
Value
Absolute change
Change from previous value
jan 1, 2005
0.46
+0.46
0.0%
jan 1, 2006
0.459
-0.001
-0.31%
jan 1, 2007
0.568
+0.109
23.8%
jan 1, 2008
0.51
-0.058
-10.22%
jan 1, 2009
0.468
-0.042
-8.15%
jan 1, 2010
0.475
+0.007
1.42%
jan 1, 2011
0.773
+0.298
62.67%
jan 1, 2012
0.642
-0.131
-16.92%
jan 1, 2013
0.75
+0.108
16.84%
jan 1, 2015
1.186
+0.436
58.05%
Ranking of countries by current statistics by years


Comments: