29
/
en
AIzaSyAYiBZKx7MnpbEhh9jyipgxe19OcubqV5w
April 1, 2024
208259
Netherlands
NLD
true
2
1
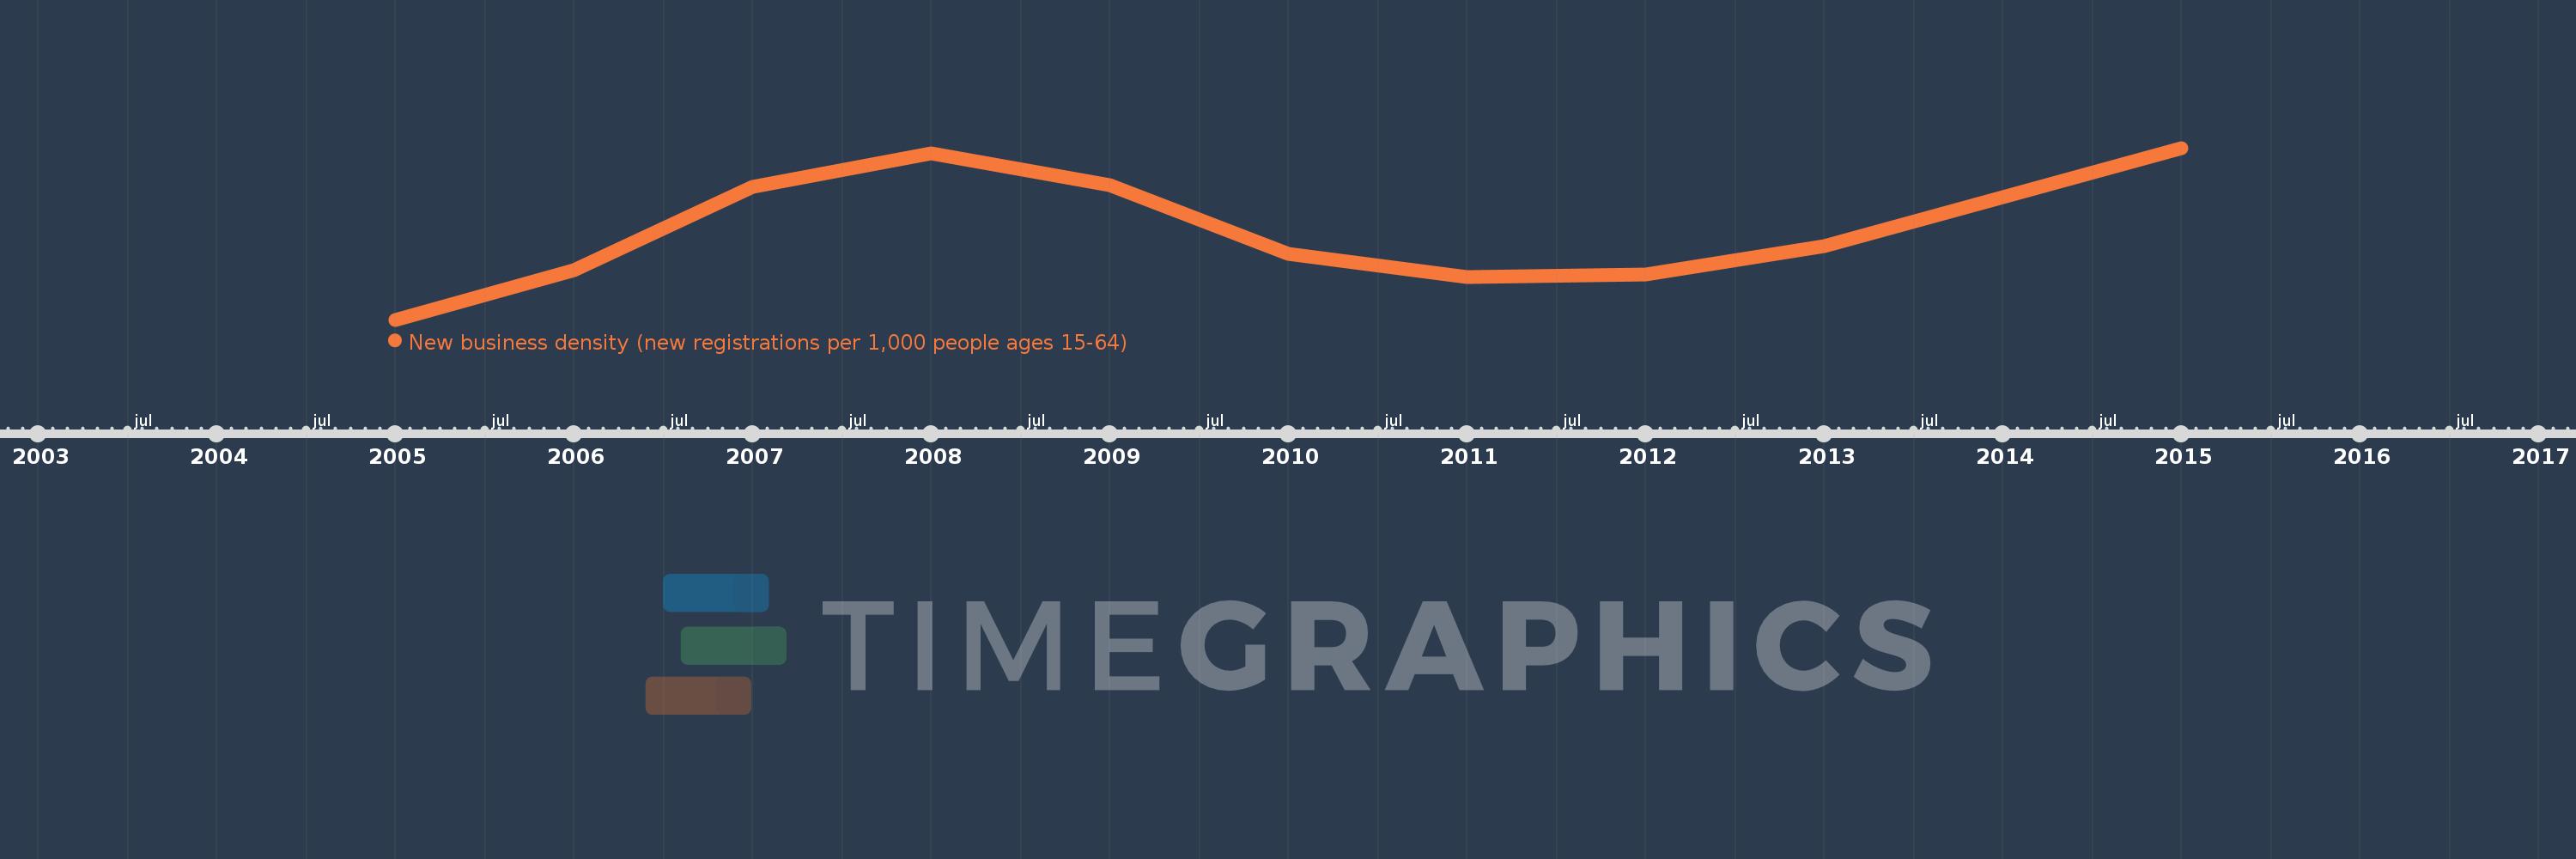
New business density (new registrations per 1,000 people ages 15-64)
2015,2013,2012,2011,2010,2009,2008,2007,2006,2005
This statistics in other country:
Timeline:
This timeline shows a graph from 2005 to 2015 of Netherlands. No data until 2004. Number of actual observations by date: 10.
Source name:
World Development Indicators
Source organization:
World Bank's Entrepreneurship Survey and database (http://econ.worldbank.org/research/entrepreneurship).
Categories, topics:
Private Sector
Last updated:
apr 23, 2017
Indicators value changes by year
At the date of observation
Value
Absolute change
Change from previous value
jan 1, 2005
3.77
+3.77
0.0%
jan 1, 2006
4.221
+0.451
11.96%
jan 1, 2007
4.981
+0.76
18.0%
jan 1, 2008
5.288
+0.307
6.17%
jan 1, 2009
5.001
-0.287
-5.44%
jan 1, 2010
4.376
-0.625
-12.49%
jan 1, 2011
4.162
-0.215
-4.91%
jan 1, 2012
4.18
+0.019
0.45%
jan 1, 2013
4.443
+0.262
6.27%
jan 1, 2015
5.34
+0.897
20.2%
Ranking of countries by current statistics by years


Comments: