29
/
en
AIzaSyAYiBZKx7MnpbEhh9jyipgxe19OcubqV5w
April 1, 2024
140814
Ghana
GHA
true
2
1
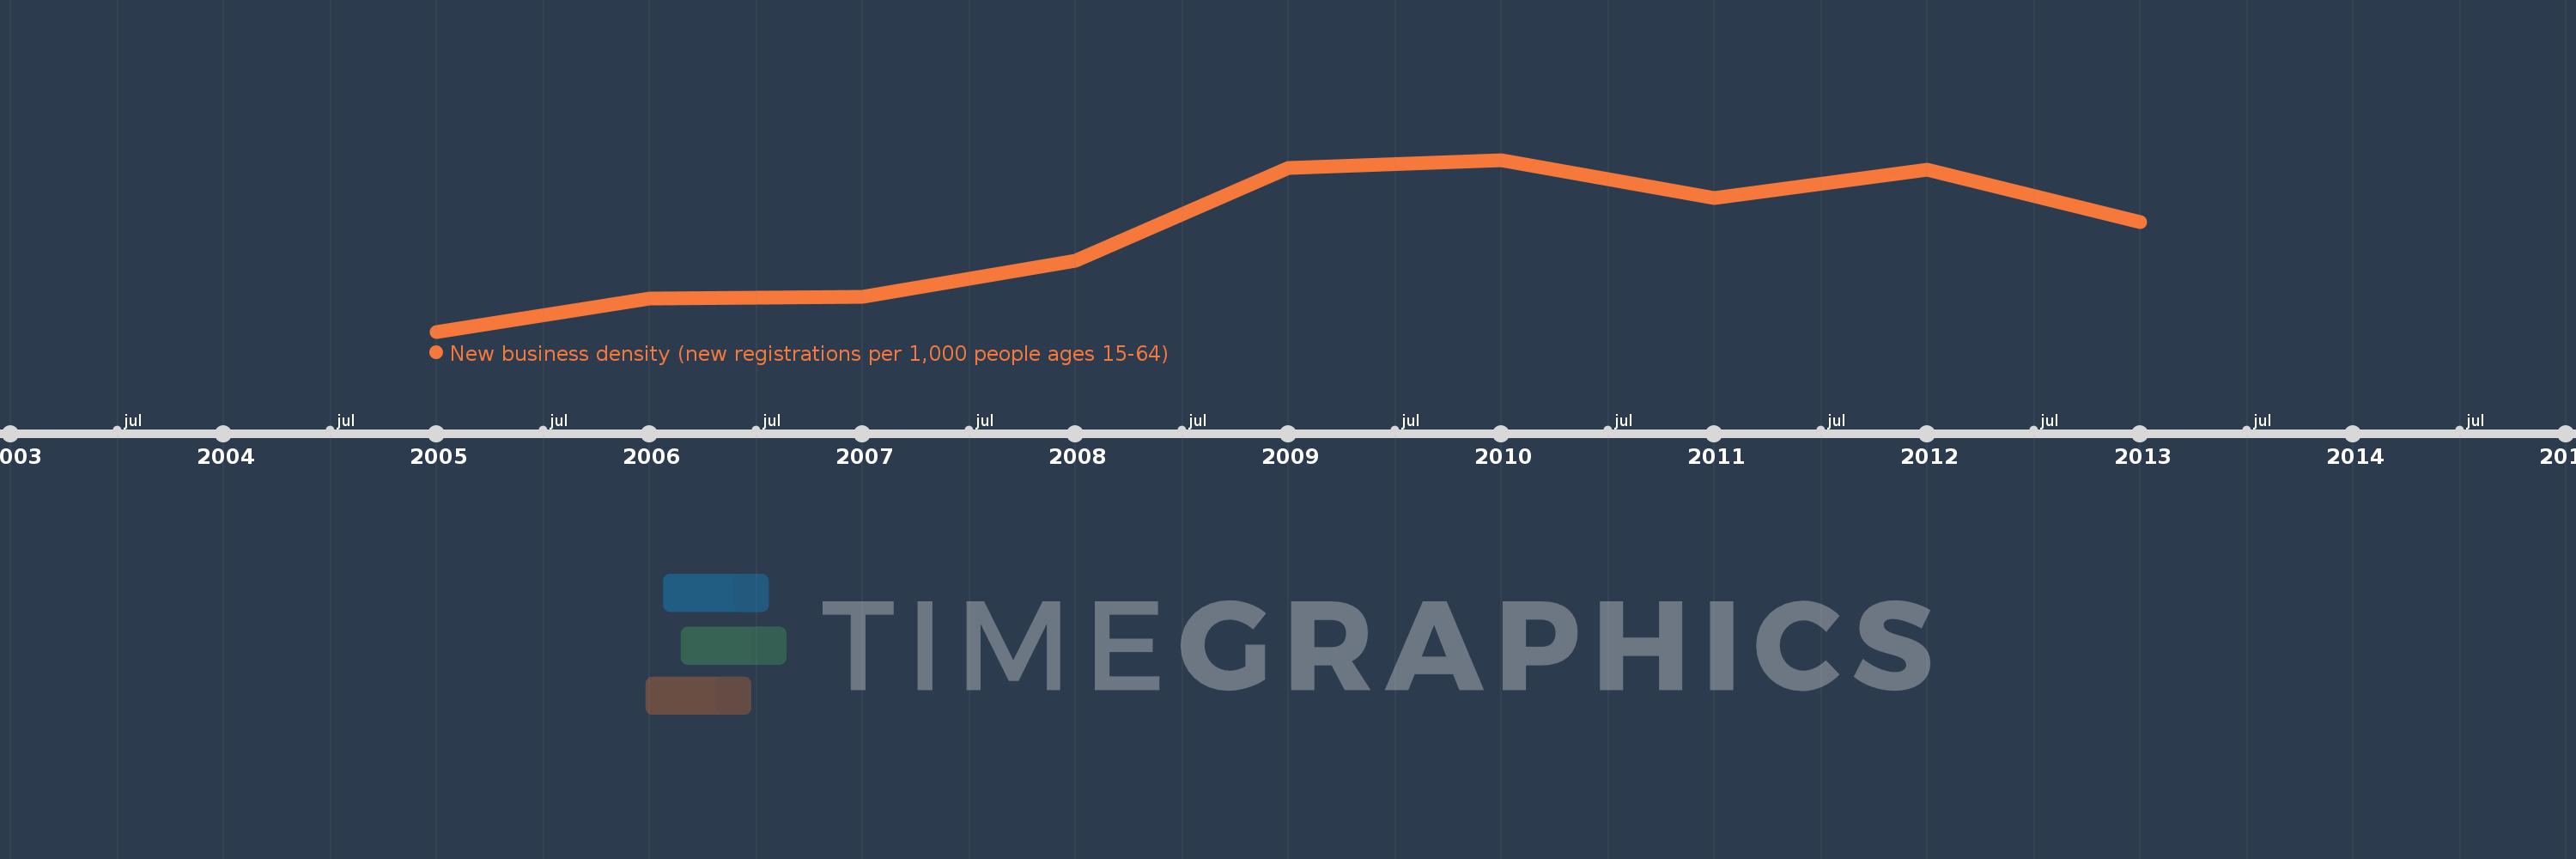
New business density (new registrations per 1,000 people ages 15-64)
2013,2012,2011,2010,2009,2008,2007,2006,2005
This statistics in other country:
Timeline:
This timeline shows a graph from 2005 to 2013 of Ghana. No data until 2004. Number of actual observations by date: 9.
Source name:
World Development Indicators
Source organization:
World Bank's Entrepreneurship Survey and database (http://econ.worldbank.org/research/entrepreneurship).
Categories, topics:
Private Sector
Last updated:
apr 23, 2017
Indicators value changes by year
At the date of observation
Value
Absolute change
Change from previous value
jan 1, 2005
0.487
+0.487
0.0%
jan 1, 2006
0.609
+0.121
24.91%
jan 1, 2007
0.616
+0.007
1.11%
jan 1, 2008
0.752
+0.136
22.09%
jan 1, 2009
1.098
+0.347
46.13%
jan 1, 2010
1.129
+0.031
2.8%
jan 1, 2011
0.986
-0.143
-12.64%
jan 1, 2012
1.093
+0.106
10.79%
jan 1, 2013
0.896
-0.197
-18.03%
Ranking of countries by current statistics by years


Comments: