29
/
en
AIzaSyAYiBZKx7MnpbEhh9jyipgxe19OcubqV5w
April 1, 2024
48946
Middle East & North Africa (excluding high income)
MNA
false
2
1
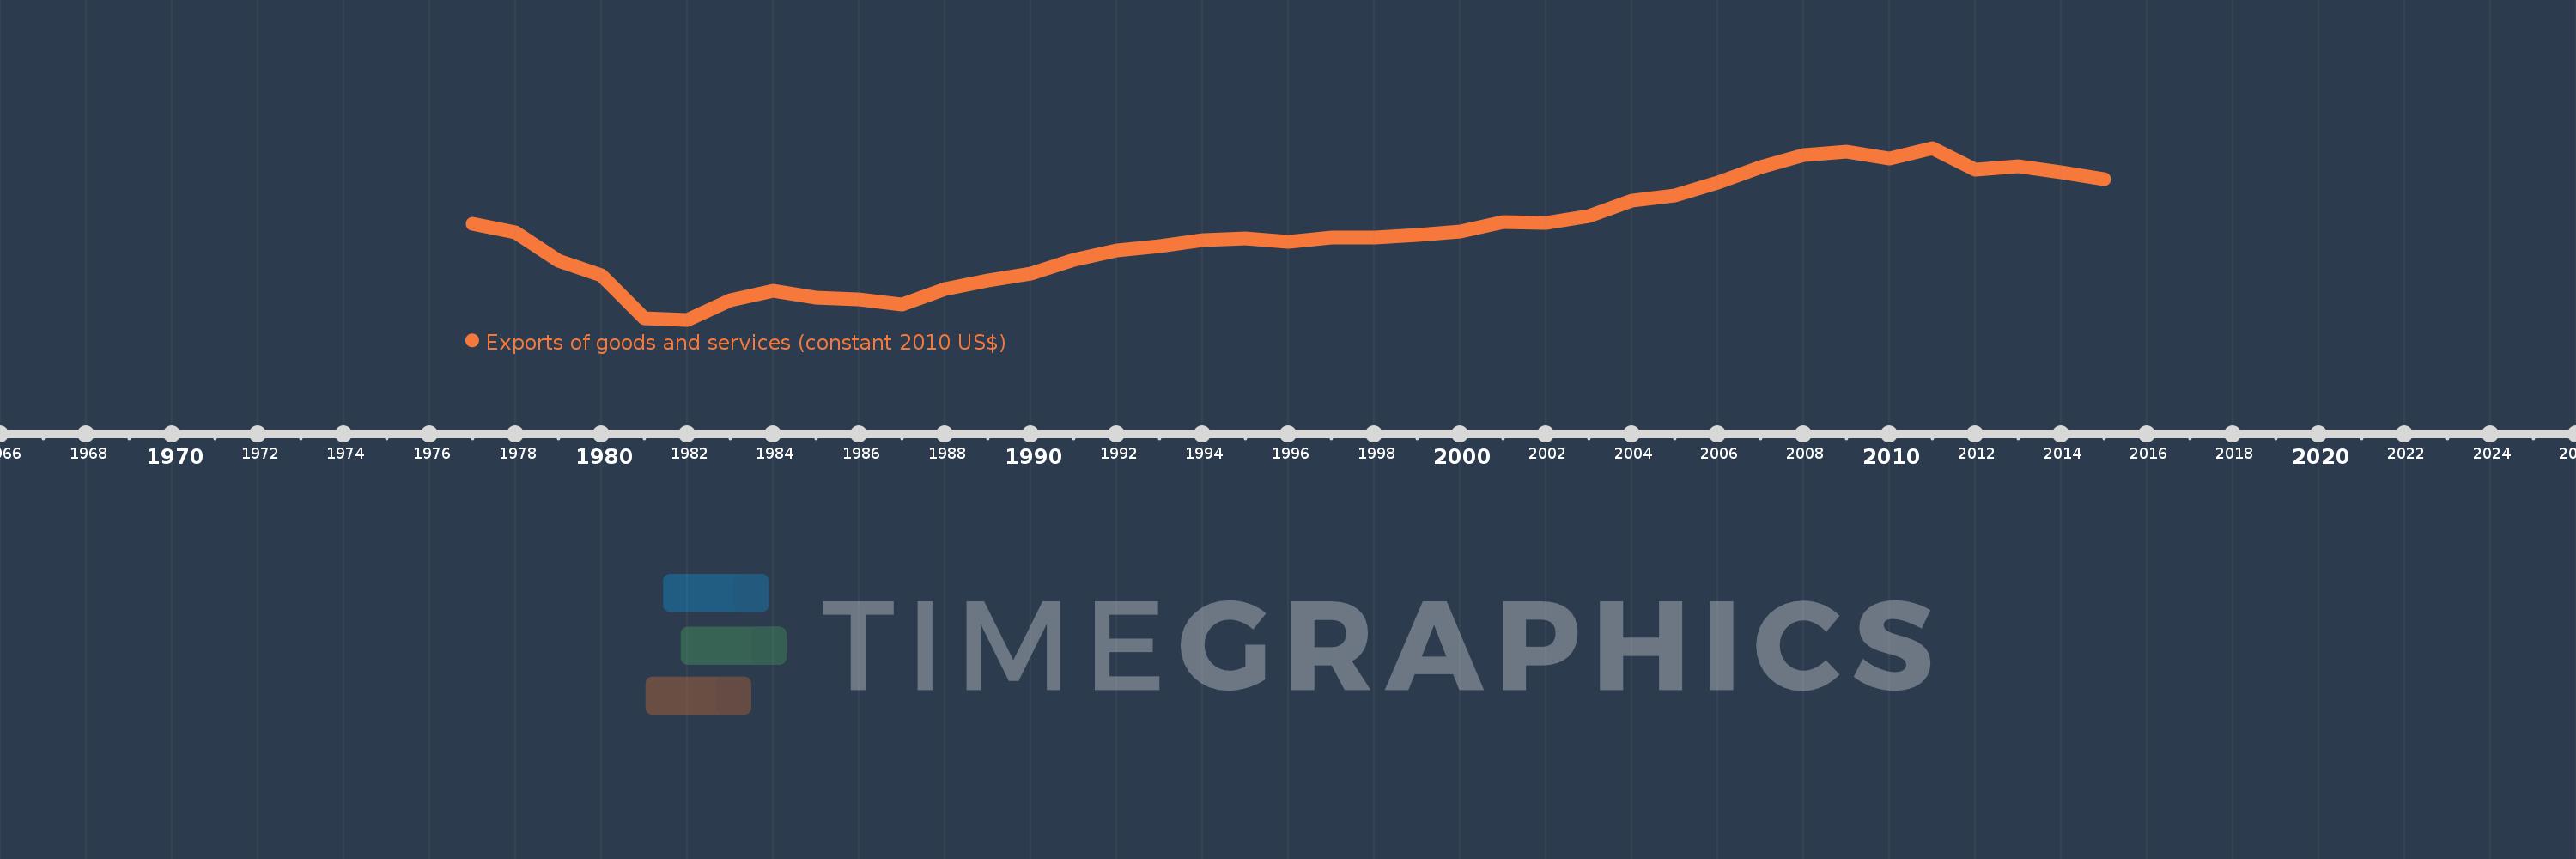
Exports of goods and services (constant 2010 US$)
2015,2014,2013,2012,2011,2010,2009,2008,2007,2006,2005,2004,2003,2002,2001,2000,1999,1998,1997,1996,1995,1994,1993,1992,1991,1990,1989,1988,1987,1986,1985,1984,1983,1982,1981,1980,1979,1978,1977
This statistics in other country:
AfghanistanAlbaniaAlgeriaAngolaAntigua and BarbudaArab WorldArgentinaArmeniaArubaAustraliaAustriaAzerbaijanBahamas, TheBahrainBangladeshBarbadosBelarusBelgiumBelizeBeninBermudaBhutanBoliviaBosnia and HerzegovinaBotswanaBrazilBrunei DarussalamBulgariaBurkina FasoBurundiCabo VerdeCambodiaCameroonCanadaCaribbean small statesCentral African RepublicCentral Europe and the BalticsChadChileChinaColombiaComorosCongo, Dem. Rep.Congo, Rep.Costa RicaCote d'IvoireCroatiaCubaCyprusCzech RepublicDenmarkDominicaDominican RepublicEarly-demographic dividendEast Asia & PacificEast Asia & Pacific (excluding high income)East Asia & Pacific (IDA & IBRD countries)EcuadorEgypt, Arab Rep.El SalvadorEquatorial GuineaEritreaEstoniaEuro areaEurope & Central AsiaEurope & Central Asia (excluding high income)Europe & Central Asia (IDA & IBRD countries)European UnionFaroe IslandsFijiFinlandFragile and conflict affected situationsFranceGabonGambia, TheGeorgiaGermanyGhanaGreeceGrenadaGuatemalaGuineaGuinea-BissauGuyanaHaitiHeavily indebted poor countries (HIPC)High incomeHondurasHong Kong SAR, ChinaHungaryIBRD onlyIcelandIDA & IBRD totalIDA blendIDA onlyIDA totalIndiaIndonesiaIran, Islamic Rep.IraqIrelandIsraelItalyJamaicaJapanJordanKazakhstanKenyaKiribatiKorea, Rep.KosovoKuwaitKyrgyz RepublicLao PDRLate-demographic dividendLatin America & Caribbean Latin America & Caribbean (excluding high income)Latin America & the Caribbean (IDA & IBRD countries)LatviaLeast developed countries: UN classificationLebanonLiberiaLibyaLithuaniaLow & middle incomeLow incomeLower middle incomeLuxembourgMacao SAR, ChinaMacedonia, FYRMadagascarMalawiMalaysiaMaldivesMaliMaltaMauritaniaMauritiusMexicoMiddle East & North AfricaMiddle East & North Africa (excluding high income)Middle East & North Africa (IDA & IBRD countries)Middle incomeMoldovaMongoliaMontenegroMoroccoMozambiqueMyanmarNamibiaNepalNetherlandsNew ZealandNicaraguaNigerNigeriaNorth AmericaNorwayOECD membersOmanOther small statesPacific island small statesPakistanPalauPanamaParaguayPeruPhilippinesPolandPortugalPost-demographic dividendPre-demographic dividendPuerto RicoQatarRomaniaRussian FederationRwandaSamoaSaudi ArabiaSenegalSerbiaSeychellesSierra LeoneSingaporeSlovak RepublicSloveniaSmall statesSolomon IslandsSouth AfricaSouth AsiaSouth Asia (IDA & IBRD)South SudanSpainSri LankaSt. Kitts and NevisSt. LuciaSt. Vincent and the GrenadinesSub-Saharan Africa Sub-Saharan Africa (excluding high income)Sub-Saharan Africa (IDA & IBRD countries)SudanSurinameSwazilandSwedenSwitzerlandTajikistanTanzaniaThailandTimor-LesteTogoTongaTrinidad and TobagoTunisiaTurkeyTurkmenistanUgandaUkraineUnited Arab EmiratesUnited KingdomUnited StatesUpper middle incomeUruguayUzbekistanVanuatuVenezuela, RBVietnamWest Bank and GazaWorldYemen, Rep.ZambiaZimbabwe Timeline:
This timeline shows a graph from 1977 to 2015 of Middle East & North Africa (excluding high income). No data until 1976. Number of actual observations by date: 39.
Source name:
World Development Indicators
Source organization:
World Bank national accounts data, and OECD National Accounts data files.
Categories, topics:
Economy & Growth, Trade
Last updated:
apr 23, 2017
Indicators value changes by year
Minimum:
105.747 bln
jan 1, 1982
Maximum:
436.515 bln
jan 1, 2011
At the date of observation
Value
Absolute change
Change from previous value
jan 1, 1977
289.824 bln
+289.824 bln
0.0%
jan 1, 1978
273.792 bln
-16.032 bln
-5.53%
jan 1, 1979
219.97 bln
-53.821 bln
-19.66%
jan 1, 1980
190.551 bln
-29.419 bln
-13.37%
jan 1, 1981
108.366 bln
-82.185 bln
-43.13%
jan 1, 1982
105.747 bln
-2.62 bln
-2.42%
jan 1, 1983
142.486 bln
+36.74 bln
34.74%
jan 1, 1984
161.999 bln
+19.513 bln
13.69%
jan 1, 1985
148.966 bln
-13.034 bln
-8.05%
jan 1, 1986
144.908 bln
-4.057 bln
-2.72%
jan 1, 1987
134.258 bln
-10.65 bln
-7.35%
jan 1, 1988
164.449 bln
+30.19 bln
22.49%
jan 1, 1989
182.01 bln
+17.561 bln
10.68%
jan 1, 1990
194.922 bln
+12.912 bln
7.09%
jan 1, 1991
220.286 bln
+25.364 bln
13.01%
jan 1, 1992
238.715 bln
+18.429 bln
8.37%
jan 1, 1993
247.016 bln
+8.301 bln
3.48%
jan 1, 1994
258.956 bln
+11.941 bln
4.83%
jan 1, 1995
262.456 bln
+3.5 bln
1.35%
jan 1, 1996
255.272 bln
-7.184 bln
-2.74%
jan 1, 1997
263.441 bln
+8.169 bln
3.2%
jan 1, 1998
263.741 bln
+299.305 mln
0.11%
jan 1, 1999
269.6 bln
+5.859 bln
2.22%
jan 1, 2000
275.87 bln
+6.27 bln
2.33%
jan 1, 2001
294.567 bln
+18.696 bln
6.78%
jan 1, 2002
291.377 bln
-3.19 bln
-1.08%
jan 1, 2003
304.789 bln
+13.412 bln
4.6%
jan 1, 2004
334.308 bln
+29.519 bln
9.69%
jan 1, 2005
345.512 bln
+11.204 bln
3.35%
jan 1, 2006
369.816 bln
+24.304 bln
7.03%
jan 1, 2007
399.889 bln
+30.073 bln
8.13%
jan 1, 2008
423.258 bln
+23.37 bln
5.84%
jan 1, 2009
429.881 bln
+6.623 bln
1.56%
jan 1, 2010
416.79 bln
-13.091 bln
-3.05%
jan 1, 2011
436.515 bln
+19.725 bln
4.73%
jan 1, 2012
394.576 bln
-41.94 bln
-9.61%
jan 1, 2013
401.73 bln
+7.154 bln
1.81%
jan 1, 2014
389.589 bln
-12.141 bln
-3.02%
jan 1, 2015
377.251 bln
-12.338 bln
-3.17%
Ranking of countries by current statistics by years


Comments: