29
/
en
AIzaSyAYiBZKx7MnpbEhh9jyipgxe19OcubqV5w
April 1, 2024
93493
Bulgaria
BGR
true
2
1
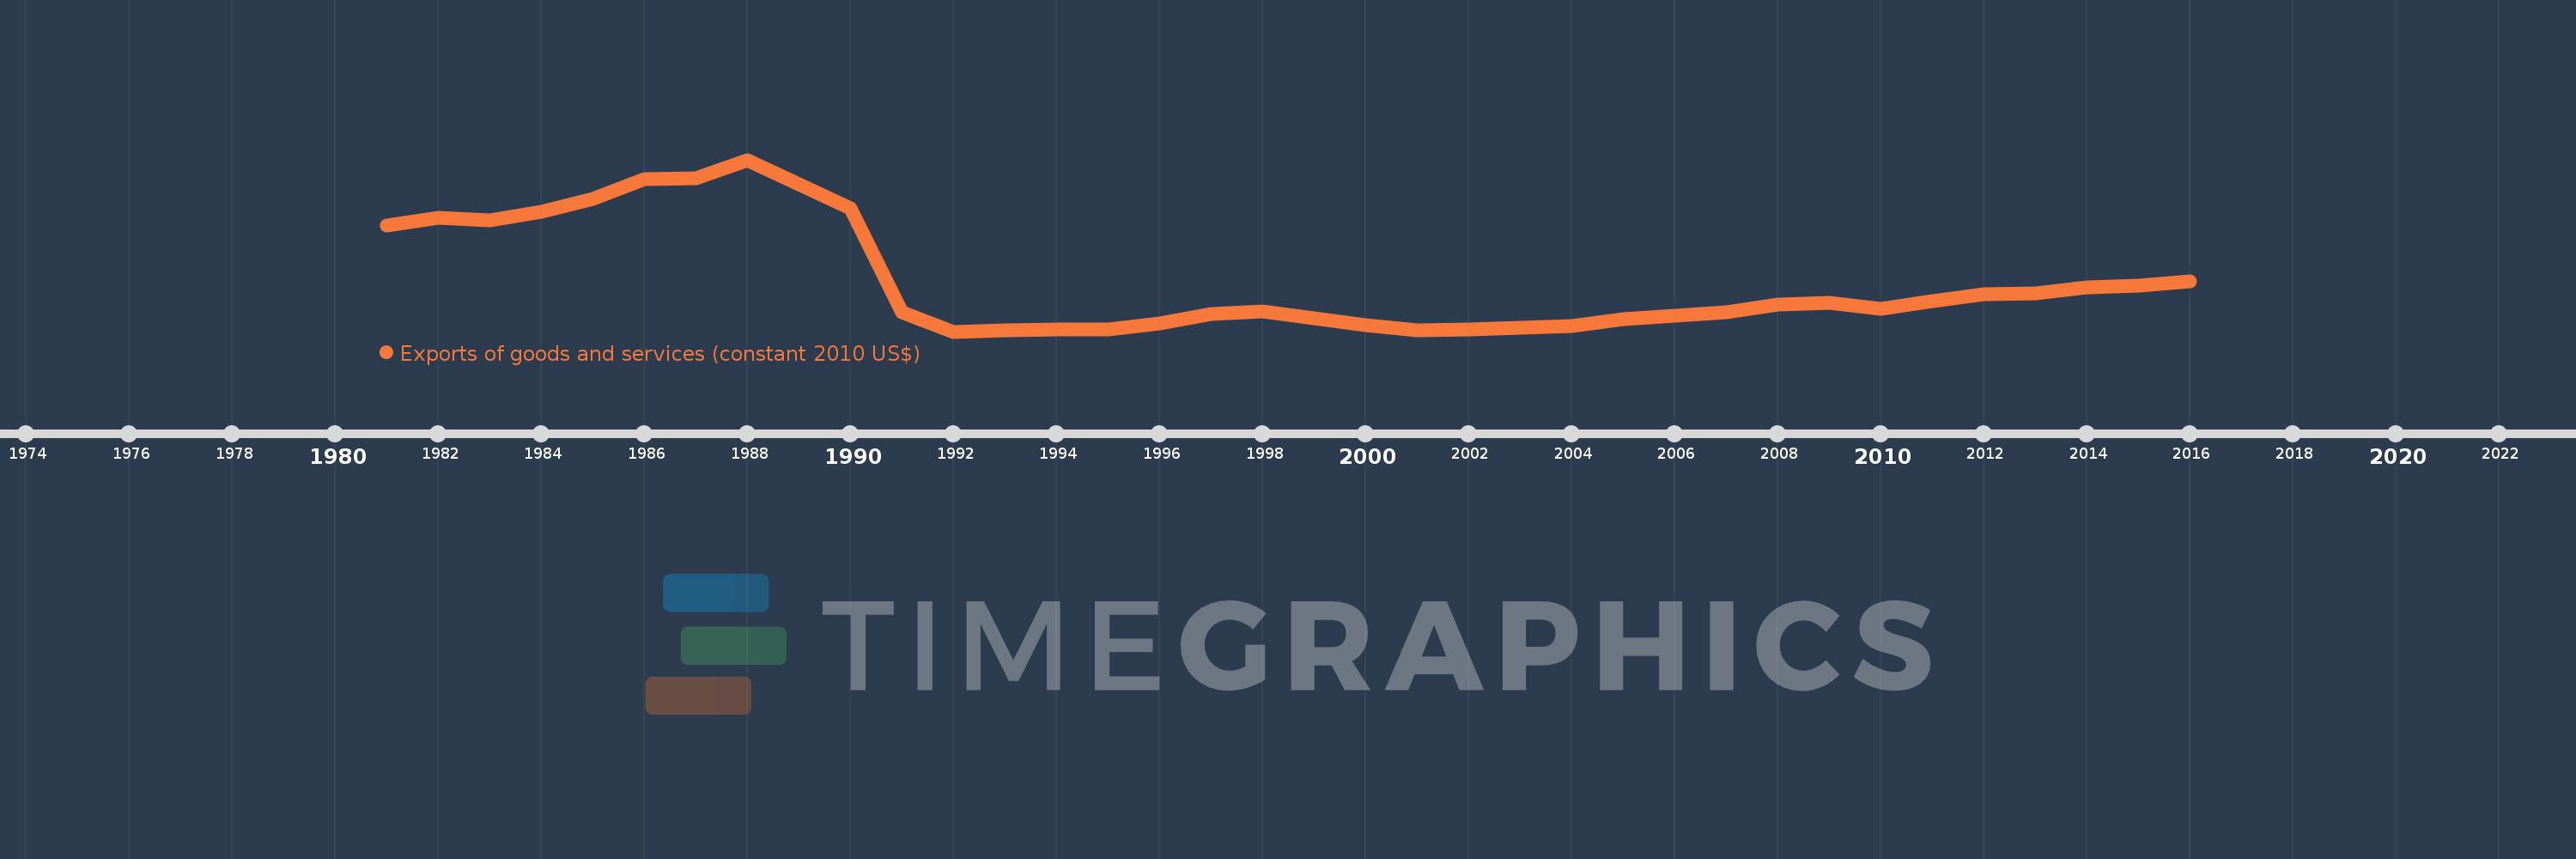
Exports of goods and services (constant 2010 US$)
2016,2015,2014,2013,2012,2011,2010,2009,2008,2007,2006,2005,2004,2003,2002,2001,2000,1999,1998,1997,1996,1995,1994,1993,1992,1991,1990,1989,1988,1987,1986,1985,1984,1983,1982,1981
This statistics in other country:
AfghanistanAlbaniaAlgeriaAngolaAntigua and BarbudaArab WorldArgentinaArmeniaArubaAustraliaAustriaAzerbaijanBahamas, TheBahrainBangladeshBarbadosBelarusBelgiumBelizeBeninBermudaBhutanBoliviaBosnia and HerzegovinaBotswanaBrazilBrunei DarussalamBulgariaBurkina FasoBurundiCabo VerdeCambodiaCameroonCanadaCaribbean small statesCentral African RepublicCentral Europe and the BalticsChadChileChinaColombiaComorosCongo, Dem. Rep.Congo, Rep.Costa RicaCote d'IvoireCroatiaCubaCyprusCzech RepublicDenmarkDominicaDominican RepublicEarly-demographic dividendEast Asia & PacificEast Asia & Pacific (excluding high income)East Asia & Pacific (IDA & IBRD countries)EcuadorEgypt, Arab Rep.El SalvadorEquatorial GuineaEritreaEstoniaEuro areaEurope & Central AsiaEurope & Central Asia (excluding high income)Europe & Central Asia (IDA & IBRD countries)European UnionFaroe IslandsFijiFinlandFragile and conflict affected situationsFranceGabonGambia, TheGeorgiaGermanyGhanaGreeceGrenadaGuatemalaGuineaGuinea-BissauGuyanaHaitiHeavily indebted poor countries (HIPC)High incomeHondurasHong Kong SAR, ChinaHungaryIBRD onlyIcelandIDA & IBRD totalIDA blendIDA onlyIDA totalIndiaIndonesiaIran, Islamic Rep.IraqIrelandIsraelItalyJamaicaJapanJordanKazakhstanKenyaKiribatiKorea, Rep.KosovoKuwaitKyrgyz RepublicLao PDRLate-demographic dividendLatin America & Caribbean Latin America & Caribbean (excluding high income)Latin America & the Caribbean (IDA & IBRD countries)LatviaLeast developed countries: UN classificationLebanonLiberiaLibyaLithuaniaLow & middle incomeLow incomeLower middle incomeLuxembourgMacao SAR, ChinaMacedonia, FYRMadagascarMalawiMalaysiaMaldivesMaliMaltaMauritaniaMauritiusMexicoMiddle East & North AfricaMiddle East & North Africa (excluding high income)Middle East & North Africa (IDA & IBRD countries)Middle incomeMoldovaMongoliaMontenegroMoroccoMozambiqueMyanmarNamibiaNepalNetherlandsNew ZealandNicaraguaNigerNigeriaNorth AmericaNorwayOECD membersOmanOther small statesPacific island small statesPakistanPalauPanamaParaguayPeruPhilippinesPolandPortugalPost-demographic dividendPre-demographic dividendPuerto RicoQatarRomaniaRussian FederationRwandaSamoaSaudi ArabiaSenegalSerbiaSeychellesSierra LeoneSingaporeSlovak RepublicSloveniaSmall statesSolomon IslandsSouth AfricaSouth AsiaSouth Asia (IDA & IBRD)South SudanSpainSri LankaSt. Kitts and NevisSt. LuciaSt. Vincent and the GrenadinesSub-Saharan Africa Sub-Saharan Africa (excluding high income)Sub-Saharan Africa (IDA & IBRD countries)SudanSurinameSwazilandSwedenSwitzerlandTajikistanTanzaniaThailandTimor-LesteTogoTongaTrinidad and TobagoTunisiaTurkeyTurkmenistanUgandaUkraineUnited Arab EmiratesUnited KingdomUnited StatesUpper middle incomeUruguayUzbekistanVanuatuVenezuela, RBVietnamWest Bank and GazaWorldYemen, Rep.ZambiaZimbabwe Timeline:
This timeline shows a graph from 1981 to 2016 of Bulgaria. No data until 1980. Number of actual observations by date: 36.
Source name:
World Development Indicators
Source organization:
World Bank national accounts data, and OECD National Accounts data files.
Categories, topics:
Economy & Growth, Trade
Last updated:
apr 23, 2017
Indicators value changes by year
Minimum:
10.902 bln
jan 1, 1992
Maximum:
93.136 bln
jan 1, 1988
At the date of observation
Value
Absolute change
Change from previous value
jan 1, 1981
61.76 bln
+61.76 bln
0.0%
jan 1, 1982
65.407 bln
+3.647 bln
5.9%
jan 1, 1983
64.095 bln
-1.312 bln
-2.01%
jan 1, 1984
68.211 bln
+4.116 bln
6.42%
jan 1, 1985
74.522 bln
+6.312 bln
9.25%
jan 1, 1986
83.897 bln
+9.375 bln
12.58%
jan 1, 1987
84.448 bln
+550.443 mln
0.66%
jan 1, 1988
93.136 bln
+8.688 bln
10.29%
jan 1, 1989
81.263 bln
-11.873 bln
-12.75%
jan 1, 1990
69.861 bln
-11.403 bln
-14.03%
jan 1, 1991
20.012 bln
-49.849 bln
-71.35%
jan 1, 1992
10.902 bln
-9.109 bln
-45.52%
jan 1, 1993
11.524 bln
+621.662 mln
5.7%
jan 1, 1994
11.8 bln
+276.219 mln
2.4%
jan 1, 1995
12.127 bln
+326.673 mln
2.77%
jan 1, 1996
14.888 bln
+2.761 bln
22.76%
jan 1, 1997
19.354 bln
+4.466 bln
30.0%
jan 1, 1998
20.727 bln
+1.373 bln
7.09%
jan 1, 1999
17.127 bln
-3.6 bln
-17.37%
jan 1, 2000
14.092 bln
-3.035 bln
-17.72%
jan 1, 2001
11.674 bln
-2.418 bln
-17.16%
jan 1, 2002
11.815 bln
+141.825 mln
1.21%
jan 1, 2003
12.862 bln
+1.047 bln
8.86%
jan 1, 2004
13.693 bln
+831.206 mln
6.46%
jan 1, 2005
17.049 bln
+3.356 bln
24.51%
jan 1, 2006
18.598 bln
+1.549 bln
9.09%
jan 1, 2007
20.023 bln
+1.425 bln
7.66%
jan 1, 2008
23.953 bln
+3.929 bln
19.62%
jan 1, 2009
24.546 bln
+593.51 mln
2.48%
jan 1, 2010
21.67 bln
-2.876 bln
-11.72%
jan 1, 2011
25.396 bln
+3.725 bln
17.19%
jan 1, 2012
28.589 bln
+3.194 bln
12.58%
jan 1, 2013
29.171 bln
+582.045 mln
2.04%
jan 1, 2014
31.984 bln
+2.813 bln
9.64%
jan 1, 2015
32.983 bln
+999.489 mln
3.12%
jan 1, 2016
34.876 bln
+1.892 bln
5.74%
Ranking of countries by current statistics by years


Comments: