29
/
en
AIzaSyAYiBZKx7MnpbEhh9jyipgxe19OcubqV5w
April 1, 2024
164767
Jordan
JOR
true
2
1
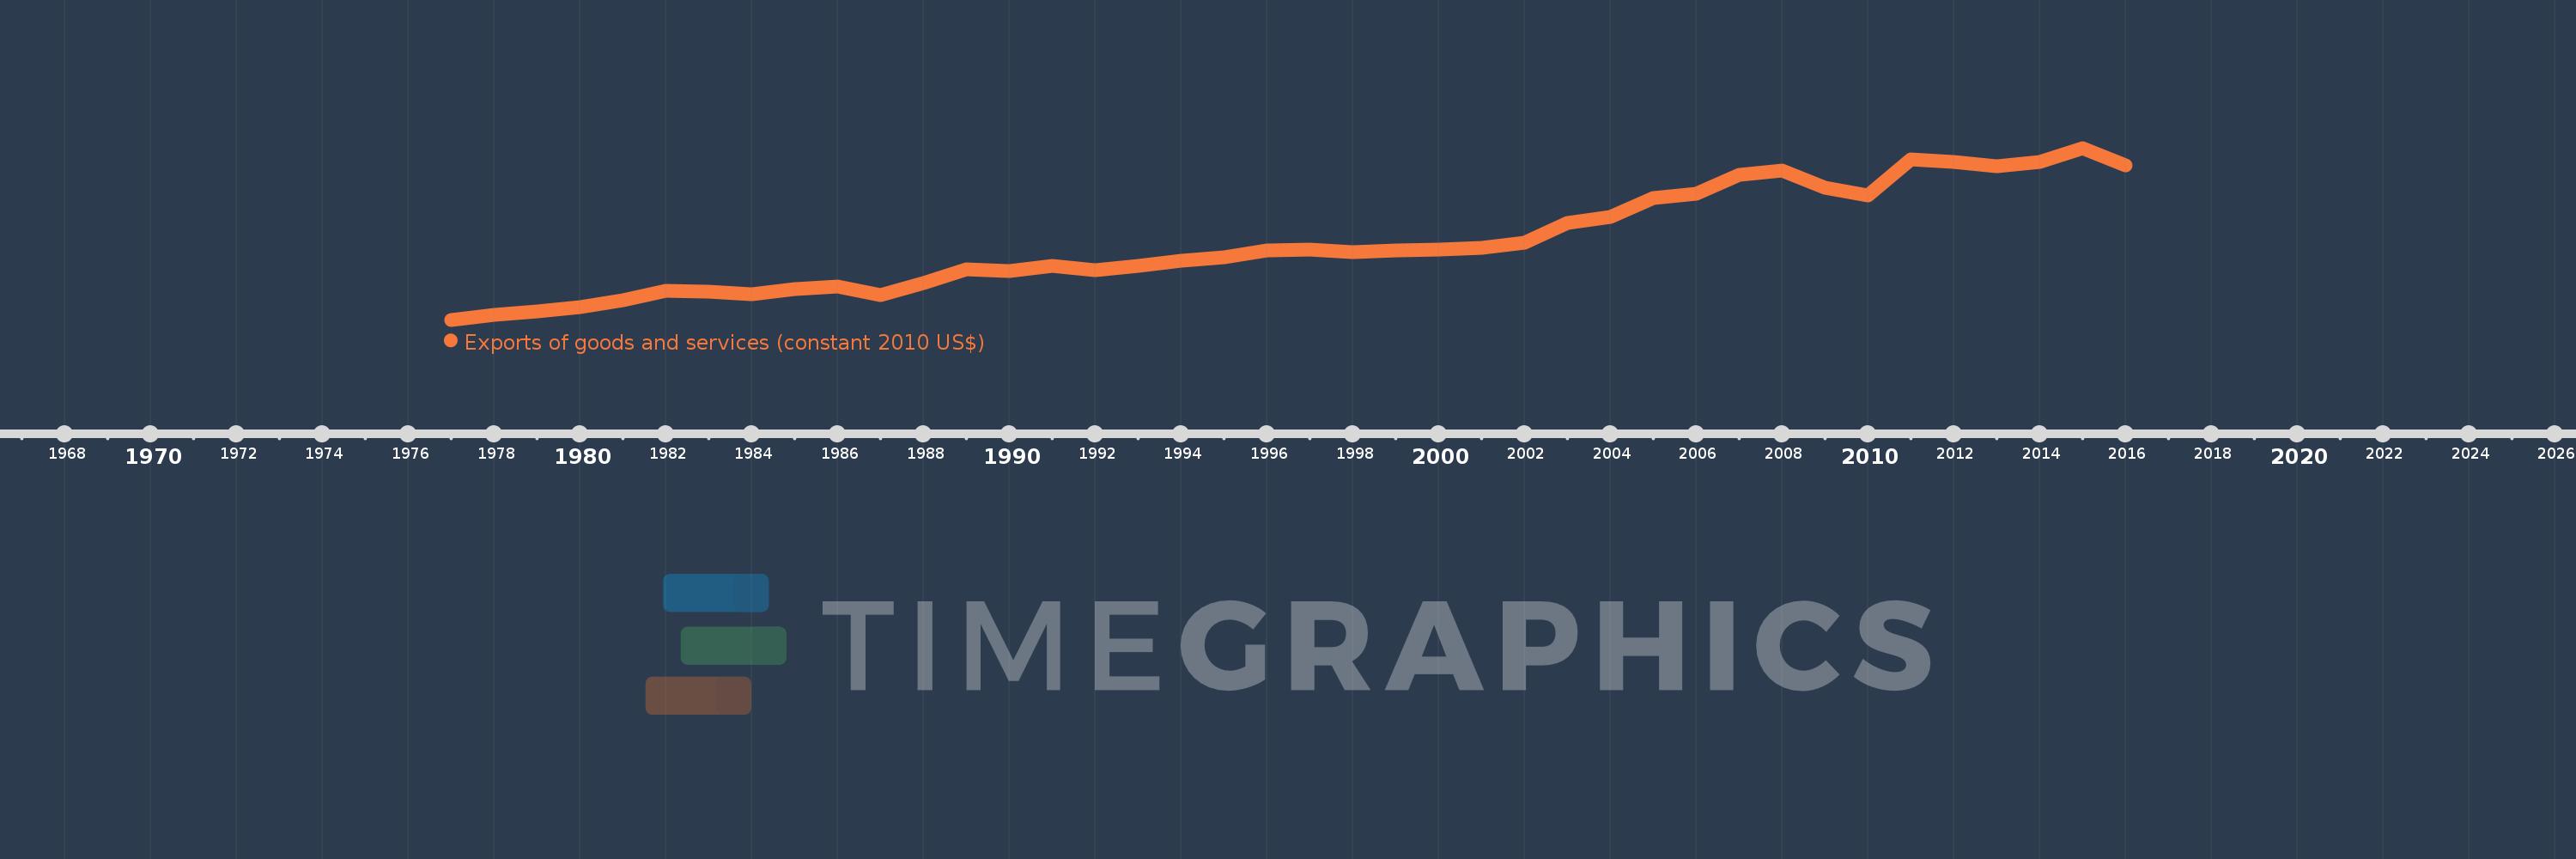
Exports of goods and services (constant 2010 US$)
2016,2015,2014,2013,2012,2011,2010,2009,2008,2007,2006,2005,2004,2003,2002,2001,2000,1999,1998,1997,1996,1995,1994,1993,1992,1991,1990,1989,1988,1987,1986,1985,1984,1983,1982,1981,1980,1979,1978,1977
This statistics in other country:
AfghanistanAlbaniaAlgeriaAngolaAntigua and BarbudaArab WorldArgentinaArmeniaArubaAustraliaAustriaAzerbaijanBahamas, TheBahrainBangladeshBarbadosBelarusBelgiumBelizeBeninBermudaBhutanBoliviaBosnia and HerzegovinaBotswanaBrazilBrunei DarussalamBulgariaBurkina FasoBurundiCabo VerdeCambodiaCameroonCanadaCaribbean small statesCentral African RepublicCentral Europe and the BalticsChadChileChinaColombiaComorosCongo, Dem. Rep.Congo, Rep.Costa RicaCote d'IvoireCroatiaCubaCyprusCzech RepublicDenmarkDominicaDominican RepublicEarly-demographic dividendEast Asia & PacificEast Asia & Pacific (excluding high income)East Asia & Pacific (IDA & IBRD countries)EcuadorEgypt, Arab Rep.El SalvadorEquatorial GuineaEritreaEstoniaEuro areaEurope & Central AsiaEurope & Central Asia (excluding high income)Europe & Central Asia (IDA & IBRD countries)European UnionFaroe IslandsFijiFinlandFragile and conflict affected situationsFranceGabonGambia, TheGeorgiaGermanyGhanaGreeceGrenadaGuatemalaGuineaGuinea-BissauGuyanaHaitiHeavily indebted poor countries (HIPC)High incomeHondurasHong Kong SAR, ChinaHungaryIBRD onlyIcelandIDA & IBRD totalIDA blendIDA onlyIDA totalIndiaIndonesiaIran, Islamic Rep.IraqIrelandIsraelItalyJamaicaJapanJordanKazakhstanKenyaKiribatiKorea, Rep.KosovoKuwaitKyrgyz RepublicLao PDRLate-demographic dividendLatin America & Caribbean Latin America & Caribbean (excluding high income)Latin America & the Caribbean (IDA & IBRD countries)LatviaLeast developed countries: UN classificationLebanonLiberiaLibyaLithuaniaLow & middle incomeLow incomeLower middle incomeLuxembourgMacao SAR, ChinaMacedonia, FYRMadagascarMalawiMalaysiaMaldivesMaliMaltaMauritaniaMauritiusMexicoMiddle East & North AfricaMiddle East & North Africa (excluding high income)Middle East & North Africa (IDA & IBRD countries)Middle incomeMoldovaMongoliaMontenegroMoroccoMozambiqueMyanmarNamibiaNepalNetherlandsNew ZealandNicaraguaNigerNigeriaNorth AmericaNorwayOECD membersOmanOther small statesPacific island small statesPakistanPalauPanamaParaguayPeruPhilippinesPolandPortugalPost-demographic dividendPre-demographic dividendPuerto RicoQatarRomaniaRussian FederationRwandaSamoaSaudi ArabiaSenegalSerbiaSeychellesSierra LeoneSingaporeSlovak RepublicSloveniaSmall statesSolomon IslandsSouth AfricaSouth AsiaSouth Asia (IDA & IBRD)South SudanSpainSri LankaSt. Kitts and NevisSt. LuciaSt. Vincent and the GrenadinesSub-Saharan Africa Sub-Saharan Africa (excluding high income)Sub-Saharan Africa (IDA & IBRD countries)SudanSurinameSwazilandSwedenSwitzerlandTajikistanTanzaniaThailandTimor-LesteTogoTongaTrinidad and TobagoTunisiaTurkeyTurkmenistanUgandaUkraineUnited Arab EmiratesUnited KingdomUnited StatesUpper middle incomeUruguayUzbekistanVanuatuVenezuela, RBVietnamWest Bank and GazaWorldYemen, Rep.ZambiaZimbabwe Timeline:
This timeline shows a graph from 1977 to 2016 of Jordan. No data until 1976. Number of actual observations by date: 40.
Source name:
World Development Indicators
Source organization:
World Bank national accounts data, and OECD National Accounts data files.
Categories, topics:
Economy & Growth, Trade
Last updated:
apr 23, 2017
Indicators value changes by year
Minimum:
1.884 bln
jan 1, 1977
Maximum:
13.546 bln
jan 1, 2015
At the date of observation
Value
Absolute change
Change from previous value
jan 1, 1977
1.884 bln
+1.884 bln
0.0%
jan 1, 1978
2.195 bln
+311.569 mln
16.54%
jan 1, 1979
2.425 bln
+229.402 mln
10.45%
jan 1, 1980
2.729 bln
+304.03 mln
12.54%
jan 1, 1981
3.231 bln
+501.724 mln
18.39%
jan 1, 1982
3.87 bln
+639.38 mln
19.79%
jan 1, 1983
3.781 bln
-88.92 mln
-2.3%
jan 1, 1984
3.597 bln
-183.794 mln
-4.86%
jan 1, 1985
3.978 bln
+380.587 mln
10.58%
jan 1, 1986
4.146 bln
+167.908 mln
4.22%
jan 1, 1987
3.576 bln
-570.041 mln
-13.75%
jan 1, 1988
4.393 bln
+817.678 mln
22.87%
jan 1, 1989
5.333 bln
+939.553 mln
21.39%
jan 1, 1990
5.207 bln
-125.853 mln
-2.36%
jan 1, 1991
5.528 bln
+321.105 mln
6.17%
jan 1, 1992
5.249 bln
-279.528 mln
-5.06%
jan 1, 1993
5.524 bln
+275.165 mln
5.24%
jan 1, 1994
5.867 bln
+342.971 mln
6.21%
jan 1, 1995
6.102 bln
+235.234 mln
4.01%
jan 1, 1996
6.603 bln
+501.079 mln
8.21%
jan 1, 1997
6.667 bln
+64.076 mln
0.97%
jan 1, 1998
6.483 bln
-184.545 mln
-2.77%
jan 1, 1999
6.572 bln
+89.106 mln
1.37%
jan 1, 2000
6.631 bln
+59.07 mln
0.9%
jan 1, 2001
6.787 bln
+156.307 mln
2.36%
jan 1, 2002
7.128 bln
+340.557 mln
5.02%
jan 1, 2003
8.431 bln
+1.304 bln
18.29%
jan 1, 2004
8.858 bln
+426.554 mln
5.06%
jan 1, 2005
10.147 bln
+1.29 bln
14.56%
jan 1, 2006
10.428 bln
+280.074 mln
2.76%
jan 1, 2007
11.728 bln
+1.3 bln
12.47%
jan 1, 2008
11.997 bln
+269.556 mln
2.3%
jan 1, 2009
10.843 bln
-1.154 bln
-9.62%
jan 1, 2010
10.31 bln
-532.115 mln
-4.91%
jan 1, 2011
12.745 bln
+2.434 bln
23.61%
jan 1, 2012
12.602 bln
-142.584 mln
-1.12%
jan 1, 2013
12.283 bln
-318.652 mln
-2.53%
jan 1, 2014
12.603 bln
+319.471 mln
2.6%
jan 1, 2015
13.546 bln
+943.726 mln
7.49%
jan 1, 2016
12.334 bln
-1.212 bln
-8.95%
Ranking of countries by current statistics by years


Comments: