29
/
en
AIzaSyAYiBZKx7MnpbEhh9jyipgxe19OcubqV5w
April 1, 2024
135454
Gabon
GAB
true
2
1
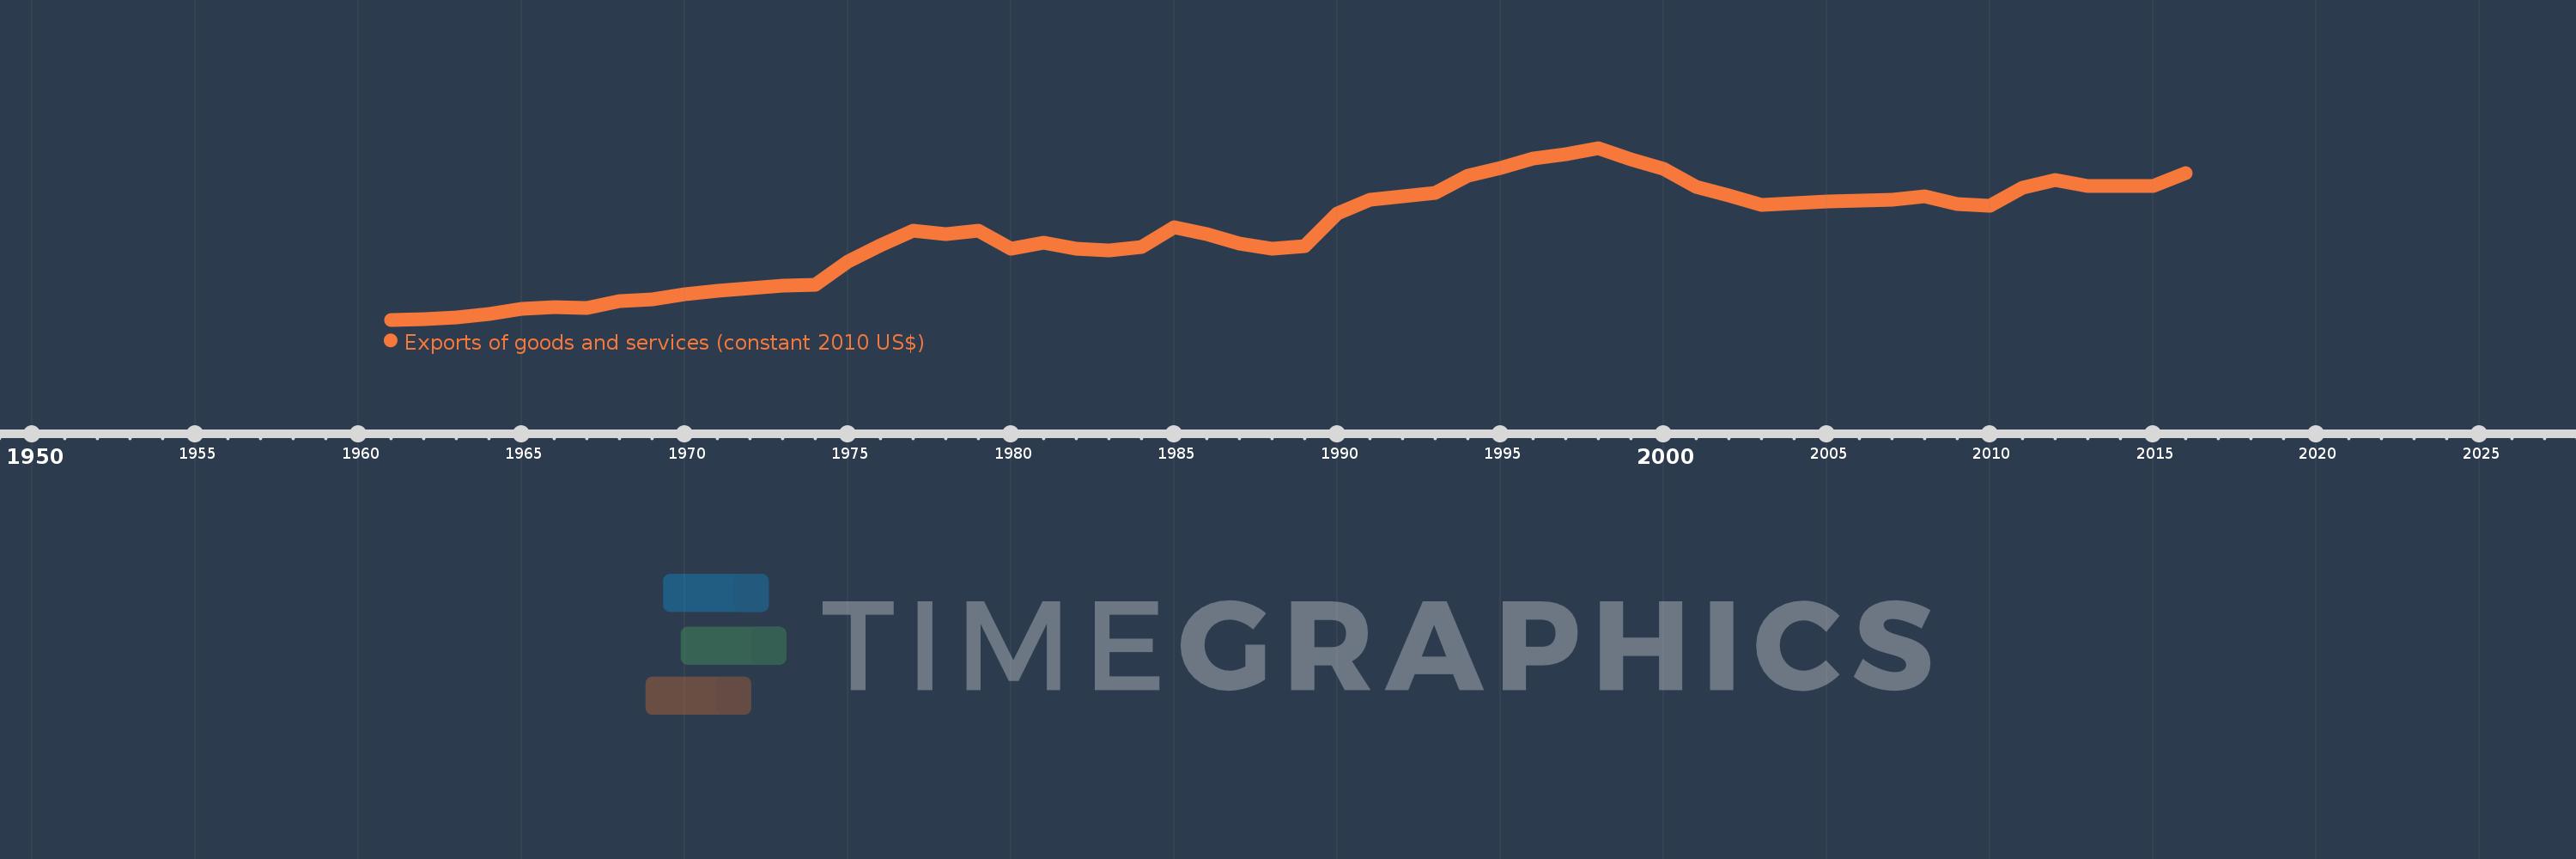
Exports of goods and services (constant 2010 US$)
2016,2015,2014,2013,2012,2011,2010,2009,2008,2007,2006,2005,2004,2003,2002,2001,2000,1999,1998,1997,1996,1995,1994,1993,1992,1991,1990,1989,1988,1987,1986,1985,1984,1983,1982,1981,1980,1979,1978,1977,1976,1975,1974,1973,1972,1971,1970,1969,1968,1967,1966,1965,1964,1963,1962,1961
This statistics in other country:
AfghanistanAlbaniaAlgeriaAngolaAntigua and BarbudaArab WorldArgentinaArmeniaArubaAustraliaAustriaAzerbaijanBahamas, TheBahrainBangladeshBarbadosBelarusBelgiumBelizeBeninBermudaBhutanBoliviaBosnia and HerzegovinaBotswanaBrazilBrunei DarussalamBulgariaBurkina FasoBurundiCabo VerdeCambodiaCameroonCanadaCaribbean small statesCentral African RepublicCentral Europe and the BalticsChadChileChinaColombiaComorosCongo, Dem. Rep.Congo, Rep.Costa RicaCote d'IvoireCroatiaCubaCyprusCzech RepublicDenmarkDominicaDominican RepublicEarly-demographic dividendEast Asia & PacificEast Asia & Pacific (excluding high income)East Asia & Pacific (IDA & IBRD countries)EcuadorEgypt, Arab Rep.El SalvadorEquatorial GuineaEritreaEstoniaEuro areaEurope & Central AsiaEurope & Central Asia (excluding high income)Europe & Central Asia (IDA & IBRD countries)European UnionFaroe IslandsFijiFinlandFragile and conflict affected situationsFranceGabonGambia, TheGeorgiaGermanyGhanaGreeceGrenadaGuatemalaGuineaGuinea-BissauGuyanaHaitiHeavily indebted poor countries (HIPC)High incomeHondurasHong Kong SAR, ChinaHungaryIBRD onlyIcelandIDA & IBRD totalIDA blendIDA onlyIDA totalIndiaIndonesiaIran, Islamic Rep.IraqIrelandIsraelItalyJamaicaJapanJordanKazakhstanKenyaKiribatiKorea, Rep.KosovoKuwaitKyrgyz RepublicLao PDRLate-demographic dividendLatin America & Caribbean Latin America & Caribbean (excluding high income)Latin America & the Caribbean (IDA & IBRD countries)LatviaLeast developed countries: UN classificationLebanonLiberiaLibyaLithuaniaLow & middle incomeLow incomeLower middle incomeLuxembourgMacao SAR, ChinaMacedonia, FYRMadagascarMalawiMalaysiaMaldivesMaliMaltaMauritaniaMauritiusMexicoMiddle East & North AfricaMiddle East & North Africa (excluding high income)Middle East & North Africa (IDA & IBRD countries)Middle incomeMoldovaMongoliaMontenegroMoroccoMozambiqueMyanmarNamibiaNepalNetherlandsNew ZealandNicaraguaNigerNigeriaNorth AmericaNorwayOECD membersOmanOther small statesPacific island small statesPakistanPalauPanamaParaguayPeruPhilippinesPolandPortugalPost-demographic dividendPre-demographic dividendPuerto RicoQatarRomaniaRussian FederationRwandaSamoaSaudi ArabiaSenegalSerbiaSeychellesSierra LeoneSingaporeSlovak RepublicSloveniaSmall statesSolomon IslandsSouth AfricaSouth AsiaSouth Asia (IDA & IBRD)South SudanSpainSri LankaSt. Kitts and NevisSt. LuciaSt. Vincent and the GrenadinesSub-Saharan Africa Sub-Saharan Africa (excluding high income)Sub-Saharan Africa (IDA & IBRD countries)SudanSurinameSwazilandSwedenSwitzerlandTajikistanTanzaniaThailandTimor-LesteTogoTongaTrinidad and TobagoTunisiaTurkeyTurkmenistanUgandaUkraineUnited Arab EmiratesUnited KingdomUnited StatesUpper middle incomeUruguayUzbekistanVanuatuVenezuela, RBVietnamWest Bank and GazaWorldYemen, Rep.ZambiaZimbabwe Timeline:
This timeline shows a graph from 1961 to 2016 of Gabon. No data until 1960. Number of actual observations by date: 56.
Source name:
World Development Indicators
Source organization:
World Bank national accounts data, and OECD National Accounts data files.
Categories, topics:
Economy & Growth, Trade
Last updated:
apr 23, 2017
Indicators value changes by year
Minimum:
693.605 mln
jan 1, 1961
Maximum:
10.552 bln
jan 1, 1998
At the date of observation
Value
Absolute change
Change from previous value
jan 1, 1961
693.605 mln
+693.605 mln
0.0%
jan 1, 1962
750.928 mln
+57.323 mln
8.26%
jan 1, 1963
831.18 mln
+80.252 mln
10.69%
jan 1, 1964
1.043 bln
+212.094 mln
25.52%
jan 1, 1965
1.295 bln
+252.22 mln
24.18%
jan 1, 1966
1.404 bln
+108.913 mln
8.41%
jan 1, 1967
1.354 bln
-50.793 mln
-3.62%
jan 1, 1968
1.743 bln
+389.82 mln
28.8%
jan 1, 1969
1.846 bln
+102.859 mln
5.9%
jan 1, 1970
2.133 bln
+286.971 mln
15.54%
jan 1, 1971
2.368 bln
+234.915 mln
11.01%
jan 1, 1972
2.507 bln
+138.405 mln
5.84%
jan 1, 1973
2.667 bln
+160.001 mln
6.38%
jan 1, 1974
2.684 bln
+17.773 mln
0.67%
jan 1, 1975
4.033 bln
+1.349 bln
50.24%
jan 1, 1976
4.983 bln
+949.823 mln
23.55%
jan 1, 1977
5.808 bln
+825.368 mln
16.56%
jan 1, 1978
5.611 bln
-196.821 mln
-3.39%
jan 1, 1979
5.823 bln
+212.057 mln
3.78%
jan 1, 1980
4.787 bln
-1.036 bln
-17.79%
jan 1, 1981
5.13 bln
+342.85 mln
7.16%
jan 1, 1982
4.76 bln
-370.362 mln
-7.22%
jan 1, 1983
4.674 bln
-85.302 mln
-1.79%
jan 1, 1984
4.873 bln
+198.678 mln
4.25%
jan 1, 1985
6.018 bln
+1.145 bln
23.49%
jan 1, 1986
5.602 bln
-415.713 mln
-6.91%
jan 1, 1987
5.086 bln
-516.132 mln
-9.21%
jan 1, 1988
4.762 bln
-323.932 mln
-6.37%
jan 1, 1989
4.918 bln
+156.567 mln
3.29%
jan 1, 1990
6.767 bln
+1.849 bln
37.59%
jan 1, 1991
7.558 bln
+791.474 mln
11.7%
jan 1, 1992
7.779 bln
+220.167 mln
2.91%
jan 1, 1993
7.977 bln
+198.587 mln
2.55%
jan 1, 1994
8.978 bln
+1.0 bln
12.54%
jan 1, 1995
9.381 bln
+402.979 mln
4.49%
jan 1, 1996
9.965 bln
+584.503 mln
6.23%
jan 1, 1997
10.207 bln
+242.148 mln
2.43%
jan 1, 1998
10.552 bln
+344.795 mln
3.38%
jan 1, 1999
9.895 bln
-657.041 mln
-6.23%
jan 1, 2000
9.371 bln
-524.445 mln
-5.3%
jan 1, 2001
8.321 bln
-1.05 bln
-11.2%
jan 1, 2002
7.84 bln
-481.433 mln
-5.79%
jan 1, 2003
7.263 bln
-576.7 mln
-7.36%
jan 1, 2004
7.394 bln
+130.84 mln
1.8%
jan 1, 2005
7.492 bln
+98.403 mln
1.33%
jan 1, 2006
7.538 bln
+45.656 mln
0.61%
jan 1, 2007
7.567 bln
+29.481 mln
0.39%
jan 1, 2008
7.801 bln
+233.34 mln
3.08%
jan 1, 2009
7.328 bln
-472.206 mln
-6.05%
jan 1, 2010
7.212 bln
-116.749 mln
-1.59%
jan 1, 2011
8.28 bln
+1.068 bln
14.81%
jan 1, 2012
8.691 bln
+411.248 mln
4.97%
jan 1, 2013
8.375 bln
-316.277 mln
-3.64%
jan 1, 2014
8.346 bln
-28.69 mln
-0.34%
jan 1, 2015
8.379 bln
+33.14 mln
0.4%
jan 1, 2016
9.105 bln
+725.545 mln
8.66%
Ranking of countries by current statistics by years


Comments: