29
/
en
AIzaSyAYiBZKx7MnpbEhh9jyipgxe19OcubqV5w
April 1, 2024
163706
Japan
JPN
true
2
1
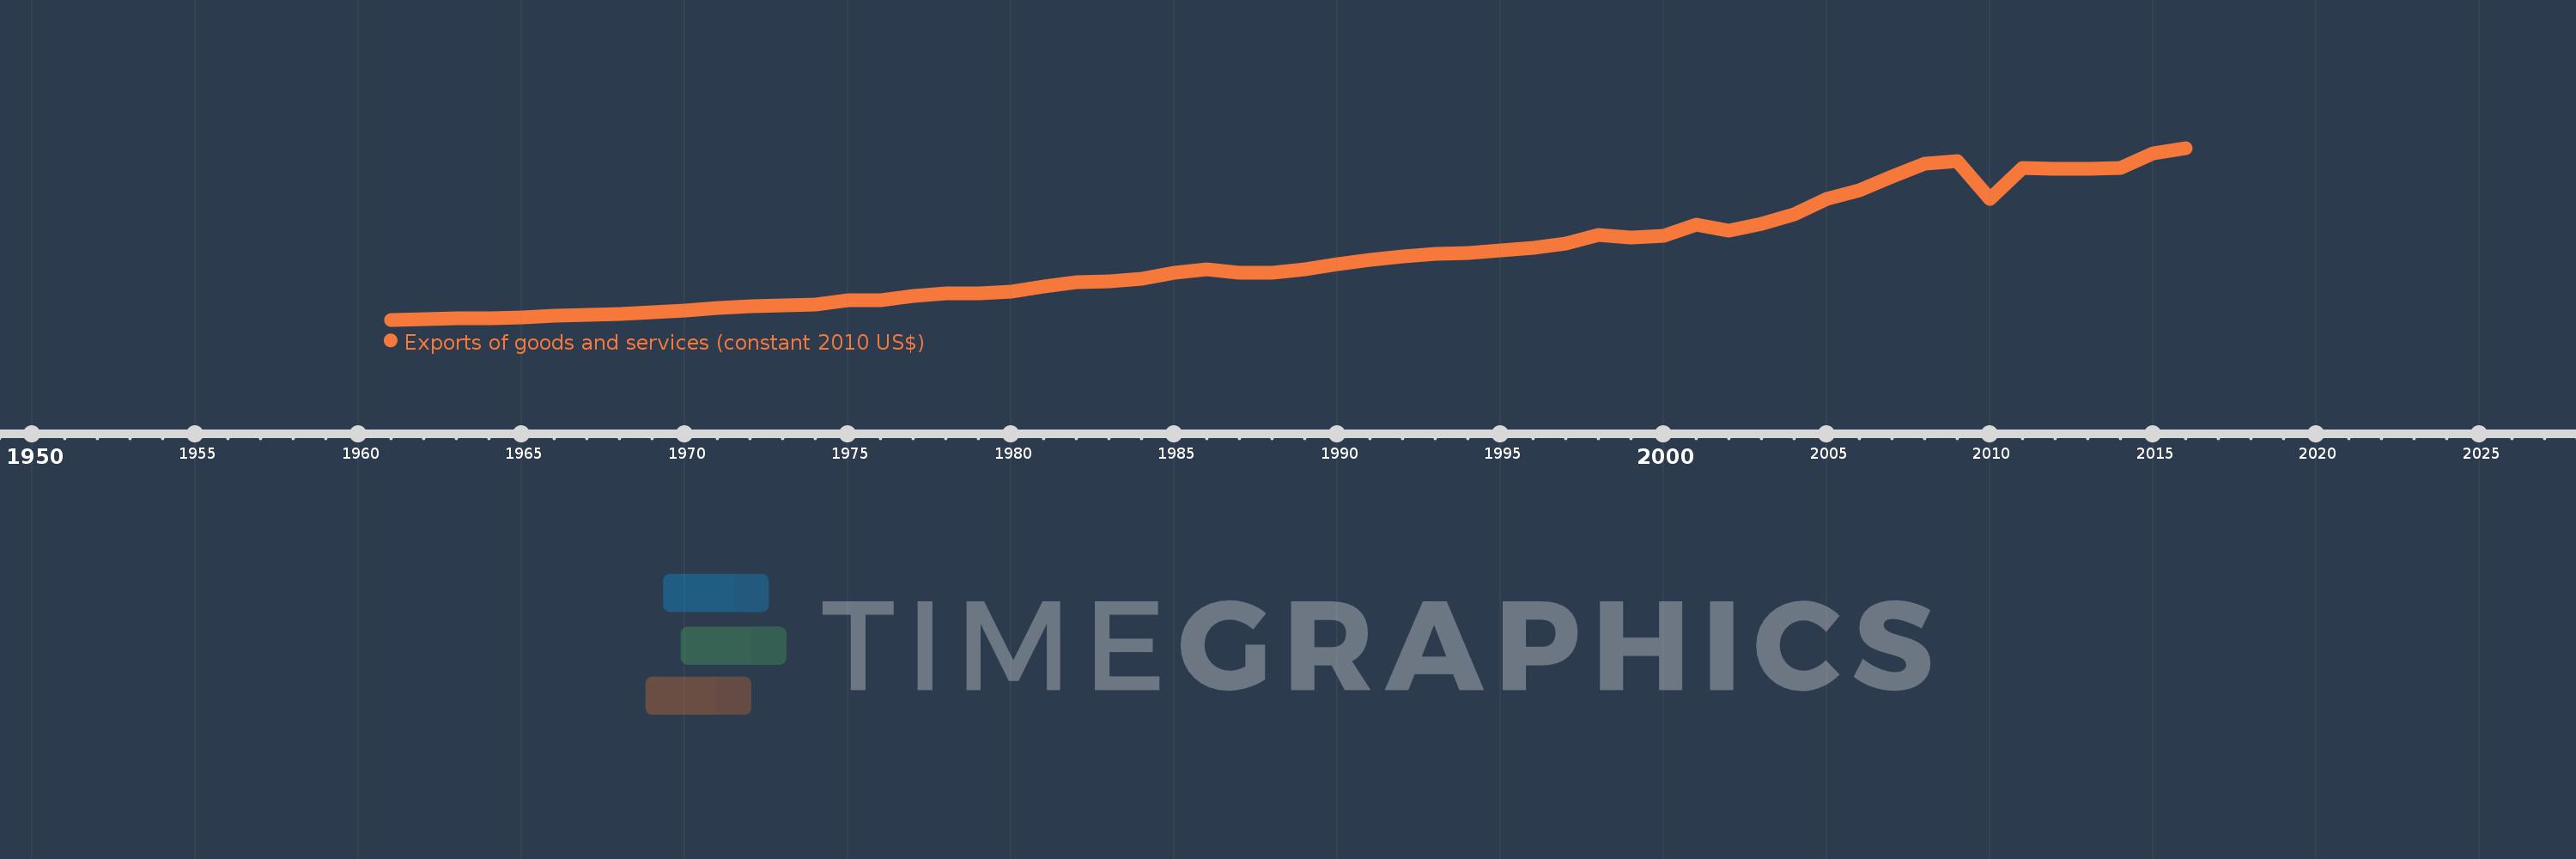
Exports of goods and services (constant 2010 US$)
2016,2015,2014,2013,2012,2011,2010,2009,2008,2007,2006,2005,2004,2003,2002,2001,2000,1999,1998,1997,1996,1995,1994,1993,1992,1991,1990,1989,1988,1987,1986,1985,1984,1983,1982,1981,1980,1979,1978,1977,1976,1975,1974,1973,1972,1971,1970,1969,1968,1967,1966,1965,1964,1963,1962,1961
This statistics in other country:
AfghanistanAlbaniaAlgeriaAngolaAntigua and BarbudaArab WorldArgentinaArmeniaArubaAustraliaAustriaAzerbaijanBahamas, TheBahrainBangladeshBarbadosBelarusBelgiumBelizeBeninBermudaBhutanBoliviaBosnia and HerzegovinaBotswanaBrazilBrunei DarussalamBulgariaBurkina FasoBurundiCabo VerdeCambodiaCameroonCanadaCaribbean small statesCentral African RepublicCentral Europe and the BalticsChadChileChinaColombiaComorosCongo, Dem. Rep.Congo, Rep.Costa RicaCote d'IvoireCroatiaCubaCyprusCzech RepublicDenmarkDominicaDominican RepublicEarly-demographic dividendEast Asia & PacificEast Asia & Pacific (excluding high income)East Asia & Pacific (IDA & IBRD countries)EcuadorEgypt, Arab Rep.El SalvadorEquatorial GuineaEritreaEstoniaEuro areaEurope & Central AsiaEurope & Central Asia (excluding high income)Europe & Central Asia (IDA & IBRD countries)European UnionFaroe IslandsFijiFinlandFragile and conflict affected situationsFranceGabonGambia, TheGeorgiaGermanyGhanaGreeceGrenadaGuatemalaGuineaGuinea-BissauGuyanaHaitiHeavily indebted poor countries (HIPC)High incomeHondurasHong Kong SAR, ChinaHungaryIBRD onlyIcelandIDA & IBRD totalIDA blendIDA onlyIDA totalIndiaIndonesiaIran, Islamic Rep.IraqIrelandIsraelItalyJamaicaJapanJordanKazakhstanKenyaKiribatiKorea, Rep.KosovoKuwaitKyrgyz RepublicLao PDRLate-demographic dividendLatin America & Caribbean Latin America & Caribbean (excluding high income)Latin America & the Caribbean (IDA & IBRD countries)LatviaLeast developed countries: UN classificationLebanonLiberiaLibyaLithuaniaLow & middle incomeLow incomeLower middle incomeLuxembourgMacao SAR, ChinaMacedonia, FYRMadagascarMalawiMalaysiaMaldivesMaliMaltaMauritaniaMauritiusMexicoMiddle East & North AfricaMiddle East & North Africa (excluding high income)Middle East & North Africa (IDA & IBRD countries)Middle incomeMoldovaMongoliaMontenegroMoroccoMozambiqueMyanmarNamibiaNepalNetherlandsNew ZealandNicaraguaNigerNigeriaNorth AmericaNorwayOECD membersOmanOther small statesPacific island small statesPakistanPalauPanamaParaguayPeruPhilippinesPolandPortugalPost-demographic dividendPre-demographic dividendPuerto RicoQatarRomaniaRussian FederationRwandaSamoaSaudi ArabiaSenegalSerbiaSeychellesSierra LeoneSingaporeSlovak RepublicSloveniaSmall statesSolomon IslandsSouth AfricaSouth AsiaSouth Asia (IDA & IBRD)South SudanSpainSri LankaSt. Kitts and NevisSt. LuciaSt. Vincent and the GrenadinesSub-Saharan Africa Sub-Saharan Africa (excluding high income)Sub-Saharan Africa (IDA & IBRD countries)SudanSurinameSwazilandSwedenSwitzerlandTajikistanTanzaniaThailandTimor-LesteTogoTongaTrinidad and TobagoTunisiaTurkeyTurkmenistanUgandaUkraineUnited Arab EmiratesUnited KingdomUnited StatesUpper middle incomeUruguayUzbekistanVanuatuVenezuela, RBVietnamWest Bank and GazaWorldYemen, Rep.ZambiaZimbabwe Timeline:
This timeline shows a graph from 1961 to 2016 of Japan. No data until 1960. Number of actual observations by date: 56.
Source name:
World Development Indicators
Source organization:
World Bank national accounts data, and OECD National Accounts data files.
Categories, topics:
Economy & Growth, Trade
Last updated:
apr 23, 2017
Indicators value changes by year
Minimum:
18.603 bln
jan 1, 1961
Maximum:
969.213 bln
jan 1, 2016
At the date of observation
Value
Absolute change
Change from previous value
jan 1, 1961
18.603 bln
+18.603 bln
0.0%
jan 1, 1962
21.579 bln
+2.976 bln
16.0%
jan 1, 1963
25.031 bln
+3.452 bln
16.0%
jan 1, 1964
29.034 bln
+4.004 bln
16.0%
jan 1, 1965
33.678 bln
+4.644 bln
16.0%
jan 1, 1966
39.066 bln
+5.387 bln
16.0%
jan 1, 1967
45.314 bln
+6.249 bln
16.0%
jan 1, 1968
52.562 bln
+7.248 bln
16.0%
jan 1, 1969
60.97 bln
+8.408 bln
16.0%
jan 1, 1970
70.722 bln
+9.752 bln
16.0%
jan 1, 1971
82.035 bln
+11.312 bln
16.0%
jan 1, 1972
95.157 bln
+13.122 bln
16.0%
jan 1, 1973
99.077 bln
+3.921 bln
4.12%
jan 1, 1974
104.267 bln
+5.19 bln
5.24%
jan 1, 1975
128.396 bln
+24.128 bln
23.14%
jan 1, 1976
127.172 bln
-1.224 bln
-0.95%
jan 1, 1977
148.284 bln
+21.112 bln
16.6%
jan 1, 1978
165.68 bln
+17.396 bln
11.73%
jan 1, 1979
165.261 bln
-418.542 mln
-0.25%
jan 1, 1980
172.375 bln
+7.114 bln
4.3%
jan 1, 1981
201.649 bln
+29.274 bln
16.98%
jan 1, 1982
228.509 bln
+26.861 bln
13.32%
jan 1, 1983
231.781 bln
+3.272 bln
1.43%
jan 1, 1984
243.305 bln
+11.524 bln
4.97%
jan 1, 1985
280.58 bln
+37.275 bln
15.32%
jan 1, 1986
295.322 bln
+14.742 bln
5.25%
jan 1, 1987
280.201 bln
-15.121 bln
-5.12%
jan 1, 1988
279.912 bln
-289.443 mln
-0.1%
jan 1, 1989
298.654 bln
+18.742 bln
6.7%
jan 1, 1990
326.95 bln
+28.296 bln
9.47%
jan 1, 1991
350.433 bln
+23.484 bln
7.18%
jan 1, 1992
368.786 bln
+18.352 bln
5.24%
jan 1, 1993
384.938 bln
+16.152 bln
4.38%
jan 1, 1994
386.336 bln
+1.398 bln
0.36%
jan 1, 1995
401.33 bln
+14.993 bln
3.88%
jan 1, 1996
418.277 bln
+16.948 bln
4.22%
jan 1, 1997
438.393 bln
+20.115 bln
4.81%
jan 1, 1998
486.845 bln
+48.453 bln
11.05%
jan 1, 1999
474.925 bln
-11.92 bln
-2.45%
jan 1, 2000
484.173 bln
+9.248 bln
1.95%
jan 1, 2001
545.86 bln
+61.686 bln
12.74%
jan 1, 2002
509.244 bln
-36.615 bln
-6.71%
jan 1, 2003
548.786 bln
+39.541 bln
7.76%
jan 1, 2004
601.007 bln
+52.221 bln
9.52%
jan 1, 2005
686.794 bln
+85.787 bln
14.27%
jan 1, 2006
736.031 bln
+49.237 bln
7.17%
jan 1, 2007
811.948 bln
+75.917 bln
10.31%
jan 1, 2008
882.361 bln
+70.413 bln
8.67%
jan 1, 2009
896.108 bln
+13.747 bln
1.56%
jan 1, 2010
686.179 bln
-209.929 bln
-23.43%
jan 1, 2011
857.11 bln
+170.931 bln
24.91%
jan 1, 2012
855.001 bln
-2.109 bln
-0.25%
jan 1, 2013
854.244 bln
-756.579 mln
-0.09%
jan 1, 2014
860.747 bln
+6.503 bln
0.76%
jan 1, 2015
940.713 bln
+79.967 bln
9.29%
jan 1, 2016
969.213 bln
+28.499 bln
3.03%
Ranking of countries by current statistics by years


Comments: