29
/
en
AIzaSyAYiBZKx7MnpbEhh9jyipgxe19OcubqV5w
April 1, 2024
104810
Chile
CHL
true
2
1
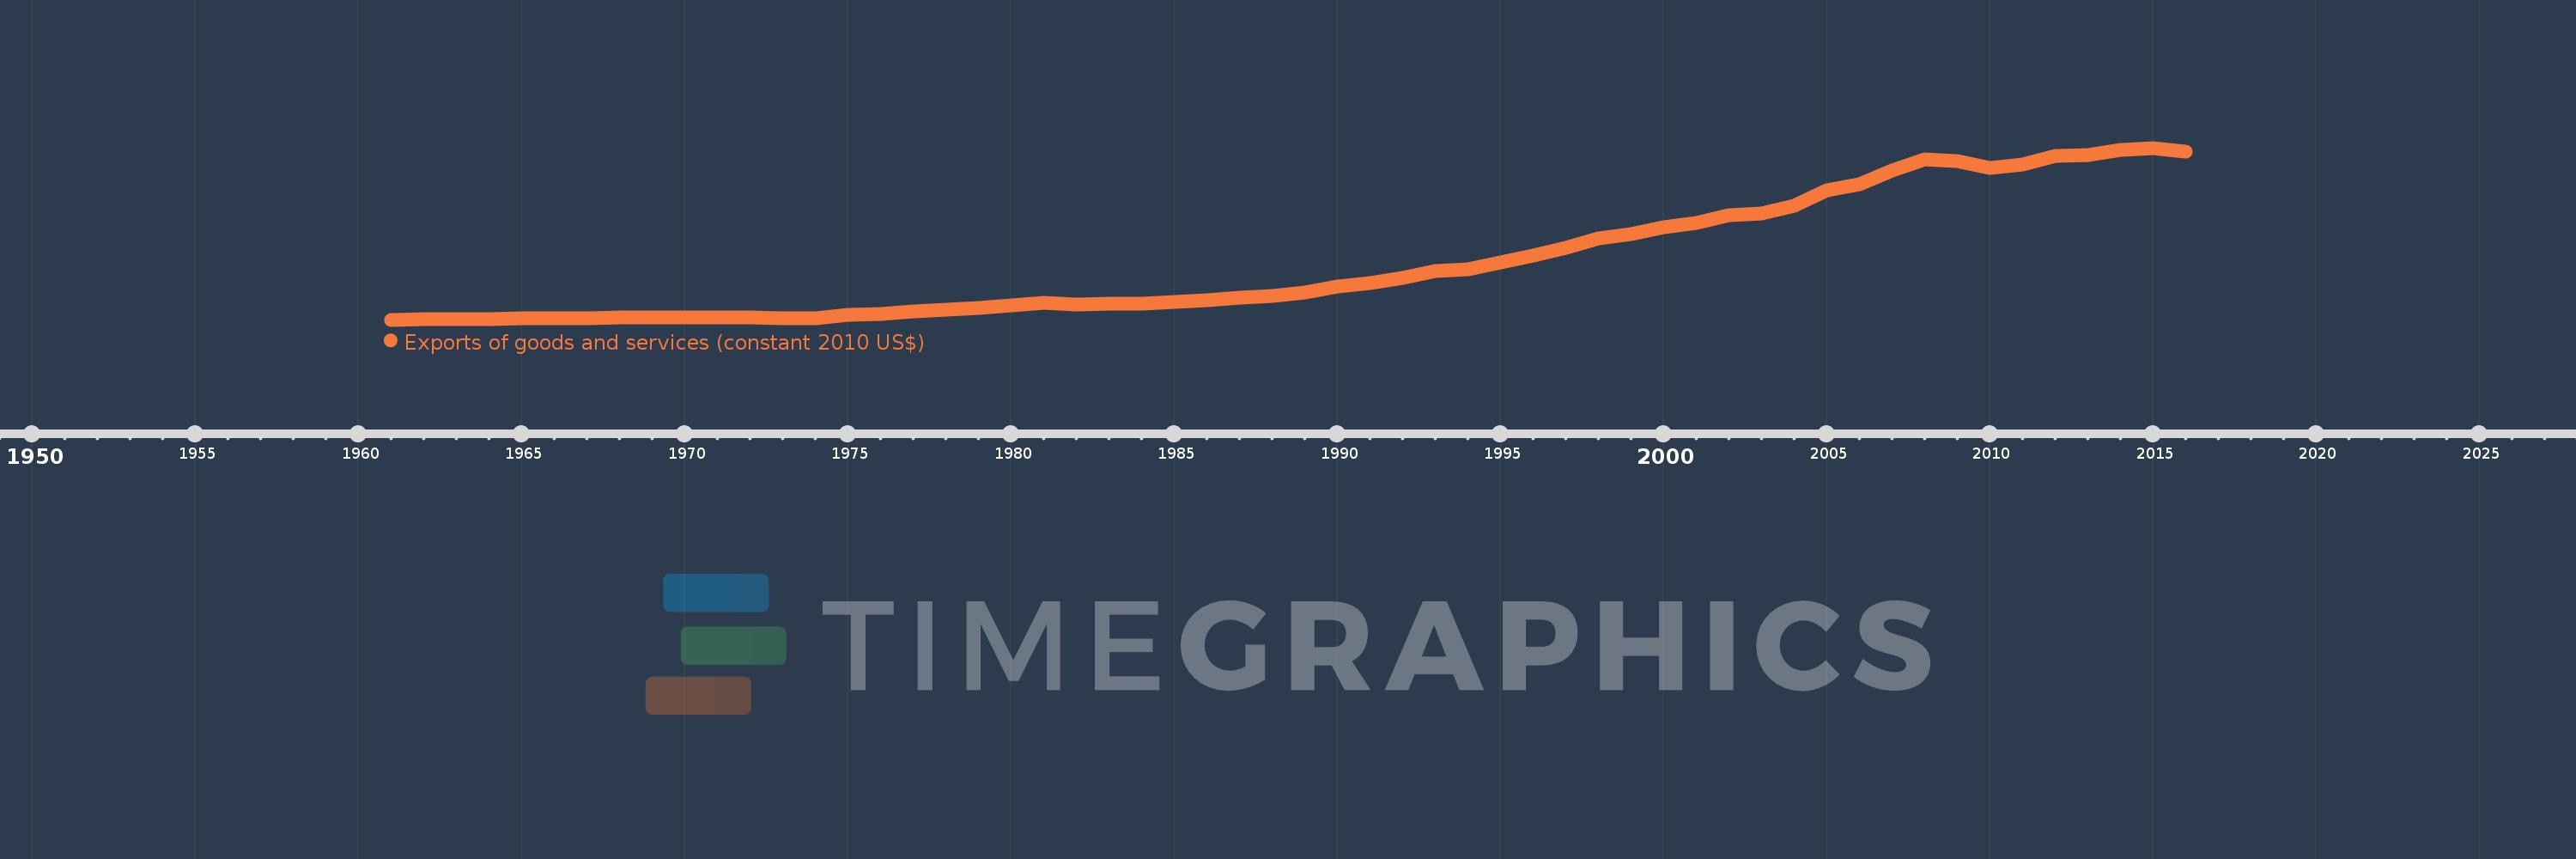
Exports of goods and services (constant 2010 US$)
2016,2015,2014,2013,2012,2011,2010,2009,2008,2007,2006,2005,2004,2003,2002,2001,2000,1999,1998,1997,1996,1995,1994,1993,1992,1991,1990,1989,1988,1987,1986,1985,1984,1983,1982,1981,1980,1979,1978,1977,1976,1975,1974,1973,1972,1971,1970,1969,1968,1967,1966,1965,1964,1963,1962,1961
This statistics in other country:
AfghanistanAlbaniaAlgeriaAngolaAntigua and BarbudaArab WorldArgentinaArmeniaArubaAustraliaAustriaAzerbaijanBahamas, TheBahrainBangladeshBarbadosBelarusBelgiumBelizeBeninBermudaBhutanBoliviaBosnia and HerzegovinaBotswanaBrazilBrunei DarussalamBulgariaBurkina FasoBurundiCabo VerdeCambodiaCameroonCanadaCaribbean small statesCentral African RepublicCentral Europe and the BalticsChadChileChinaColombiaComorosCongo, Dem. Rep.Congo, Rep.Costa RicaCote d'IvoireCroatiaCubaCyprusCzech RepublicDenmarkDominicaDominican RepublicEarly-demographic dividendEast Asia & PacificEast Asia & Pacific (excluding high income)East Asia & Pacific (IDA & IBRD countries)EcuadorEgypt, Arab Rep.El SalvadorEquatorial GuineaEritreaEstoniaEuro areaEurope & Central AsiaEurope & Central Asia (excluding high income)Europe & Central Asia (IDA & IBRD countries)European UnionFaroe IslandsFijiFinlandFragile and conflict affected situationsFranceGabonGambia, TheGeorgiaGermanyGhanaGreeceGrenadaGuatemalaGuineaGuinea-BissauGuyanaHaitiHeavily indebted poor countries (HIPC)High incomeHondurasHong Kong SAR, ChinaHungaryIBRD onlyIcelandIDA & IBRD totalIDA blendIDA onlyIDA totalIndiaIndonesiaIran, Islamic Rep.IraqIrelandIsraelItalyJamaicaJapanJordanKazakhstanKenyaKiribatiKorea, Rep.KosovoKuwaitKyrgyz RepublicLao PDRLate-demographic dividendLatin America & Caribbean Latin America & Caribbean (excluding high income)Latin America & the Caribbean (IDA & IBRD countries)LatviaLeast developed countries: UN classificationLebanonLiberiaLibyaLithuaniaLow & middle incomeLow incomeLower middle incomeLuxembourgMacao SAR, ChinaMacedonia, FYRMadagascarMalawiMalaysiaMaldivesMaliMaltaMauritaniaMauritiusMexicoMiddle East & North AfricaMiddle East & North Africa (excluding high income)Middle East & North Africa (IDA & IBRD countries)Middle incomeMoldovaMongoliaMontenegroMoroccoMozambiqueMyanmarNamibiaNepalNetherlandsNew ZealandNicaraguaNigerNigeriaNorth AmericaNorwayOECD membersOmanOther small statesPacific island small statesPakistanPalauPanamaParaguayPeruPhilippinesPolandPortugalPost-demographic dividendPre-demographic dividendPuerto RicoQatarRomaniaRussian FederationRwandaSamoaSaudi ArabiaSenegalSerbiaSeychellesSierra LeoneSingaporeSlovak RepublicSloveniaSmall statesSolomon IslandsSouth AfricaSouth AsiaSouth Asia (IDA & IBRD)South SudanSpainSri LankaSt. Kitts and NevisSt. LuciaSt. Vincent and the GrenadinesSub-Saharan Africa Sub-Saharan Africa (excluding high income)Sub-Saharan Africa (IDA & IBRD countries)SudanSurinameSwazilandSwedenSwitzerlandTajikistanTanzaniaThailandTimor-LesteTogoTongaTrinidad and TobagoTunisiaTurkeyTurkmenistanUgandaUkraineUnited Arab EmiratesUnited KingdomUnited StatesUpper middle incomeUruguayUzbekistanVanuatuVenezuela, RBVietnamWest Bank and GazaWorldYemen, Rep.ZambiaZimbabwe Timeline:
This timeline shows a graph from 1961 to 2016 of Chile. No data until 1960. Number of actual observations by date: 56.
Source name:
World Development Indicators
Source organization:
World Bank national accounts data, and OECD National Accounts data files.
Categories, topics:
Economy & Growth, Trade
Last updated:
apr 23, 2017
Indicators value changes by year
Minimum:
3.205 bln
jan 1, 1961
Maximum:
91.293 bln
jan 1, 2015
At the date of observation
Value
Absolute change
Change from previous value
jan 1, 1961
3.205 bln
+3.205 bln
0.0%
jan 1, 1962
3.364 bln
+158.423 mln
4.94%
jan 1, 1963
3.451 bln
+87.791 mln
2.61%
jan 1, 1964
3.634 bln
+182.162 mln
5.28%
jan 1, 1965
3.969 bln
+335.397 mln
9.23%
jan 1, 1966
3.935 bln
-33.836 mln
-0.85%
jan 1, 1967
4.093 bln
+157.719 mln
4.01%
jan 1, 1968
4.227 bln
+133.863 mln
3.27%
jan 1, 1969
4.312 bln
+85.813 mln
2.03%
jan 1, 1970
4.466 bln
+153.089 mln
3.55%
jan 1, 1971
4.558 bln
+92.144 mln
2.06%
jan 1, 1972
4.595 bln
+37.499 mln
0.82%
jan 1, 1973
3.901 bln
-694.401 mln
-15.11%
jan 1, 1974
4.01 bln
+108.849 mln
2.79%
jan 1, 1975
5.852 bln
+1.842 bln
45.95%
jan 1, 1976
5.99 bln
+137.497 mln
2.35%
jan 1, 1977
7.449 bln
+1.46 bln
24.37%
jan 1, 1978
8.334 bln
+884.988 mln
11.88%
jan 1, 1979
9.267 bln
+932.615 mln
11.19%
jan 1, 1980
10.578 bln
+1.311 bln
14.14%
jan 1, 1981
12.079 bln
+1.501 bln
14.19%
jan 1, 1982
10.998 bln
-1.081 bln
-8.95%
jan 1, 1983
11.516 bln
+518.644 mln
4.72%
jan 1, 1984
11.599 bln
+82.574 mln
0.72%
jan 1, 1985
12.377 bln
+777.649 mln
6.7%
jan 1, 1986
13.239 bln
+862.013 mln
6.96%
jan 1, 1987
14.575 bln
+1.337 bln
10.1%
jan 1, 1988
15.558 bln
+982.481 mln
6.74%
jan 1, 1989
17.355 bln
+1.798 bln
11.56%
jan 1, 1990
20.152 bln
+2.796 bln
16.11%
jan 1, 1991
21.888 bln
+1.736 bln
8.62%
jan 1, 1992
24.61 bln
+2.722 bln
12.43%
jan 1, 1993
28.037 bln
+3.427 bln
13.93%
jan 1, 1994
29.028 bln
+990.892 mln
3.53%
jan 1, 1995
32.403 bln
+3.375 bln
11.63%
jan 1, 1996
35.962 bln
+3.559 bln
10.98%
jan 1, 1997
40.2 bln
+4.238 bln
11.78%
jan 1, 1998
44.702 bln
+4.502 bln
11.2%
jan 1, 1999
47.041 bln
+2.338 bln
5.23%
jan 1, 2000
50.485 bln
+3.444 bln
7.32%
jan 1, 2001
53.047 bln
+2.563 bln
5.08%
jan 1, 2002
56.884 bln
+3.836 bln
7.23%
jan 1, 2003
57.796 bln
+912.36 mln
1.6%
jan 1, 2004
61.531 bln
+3.735 bln
6.46%
jan 1, 2005
69.715 bln
+8.184 bln
13.3%
jan 1, 2006
72.724 bln
+3.01 bln
4.32%
jan 1, 2007
79.642 bln
+6.918 bln
9.51%
jan 1, 2008
85.368 bln
+5.726 bln
7.19%
jan 1, 2009
84.771 bln
-597.495 mln
-0.7%
jan 1, 2010
80.914 bln
-3.857 bln
-4.55%
jan 1, 2011
82.795 bln
+1.881 bln
2.32%
jan 1, 2012
87.362 bln
+4.567 bln
5.52%
jan 1, 2013
87.461 bln
+99.23 mln
0.11%
jan 1, 2014
90.343 bln
+2.882 bln
3.29%
jan 1, 2015
91.293 bln
+950.347 mln
1.05%
jan 1, 2016
89.573 bln
-1.721 bln
-1.88%
Ranking of countries by current statistics by years


Comments: