29
/
en
AIzaSyAYiBZKx7MnpbEhh9jyipgxe19OcubqV5w
April 1, 2024
225842
Portugal
PRT
true
2
1
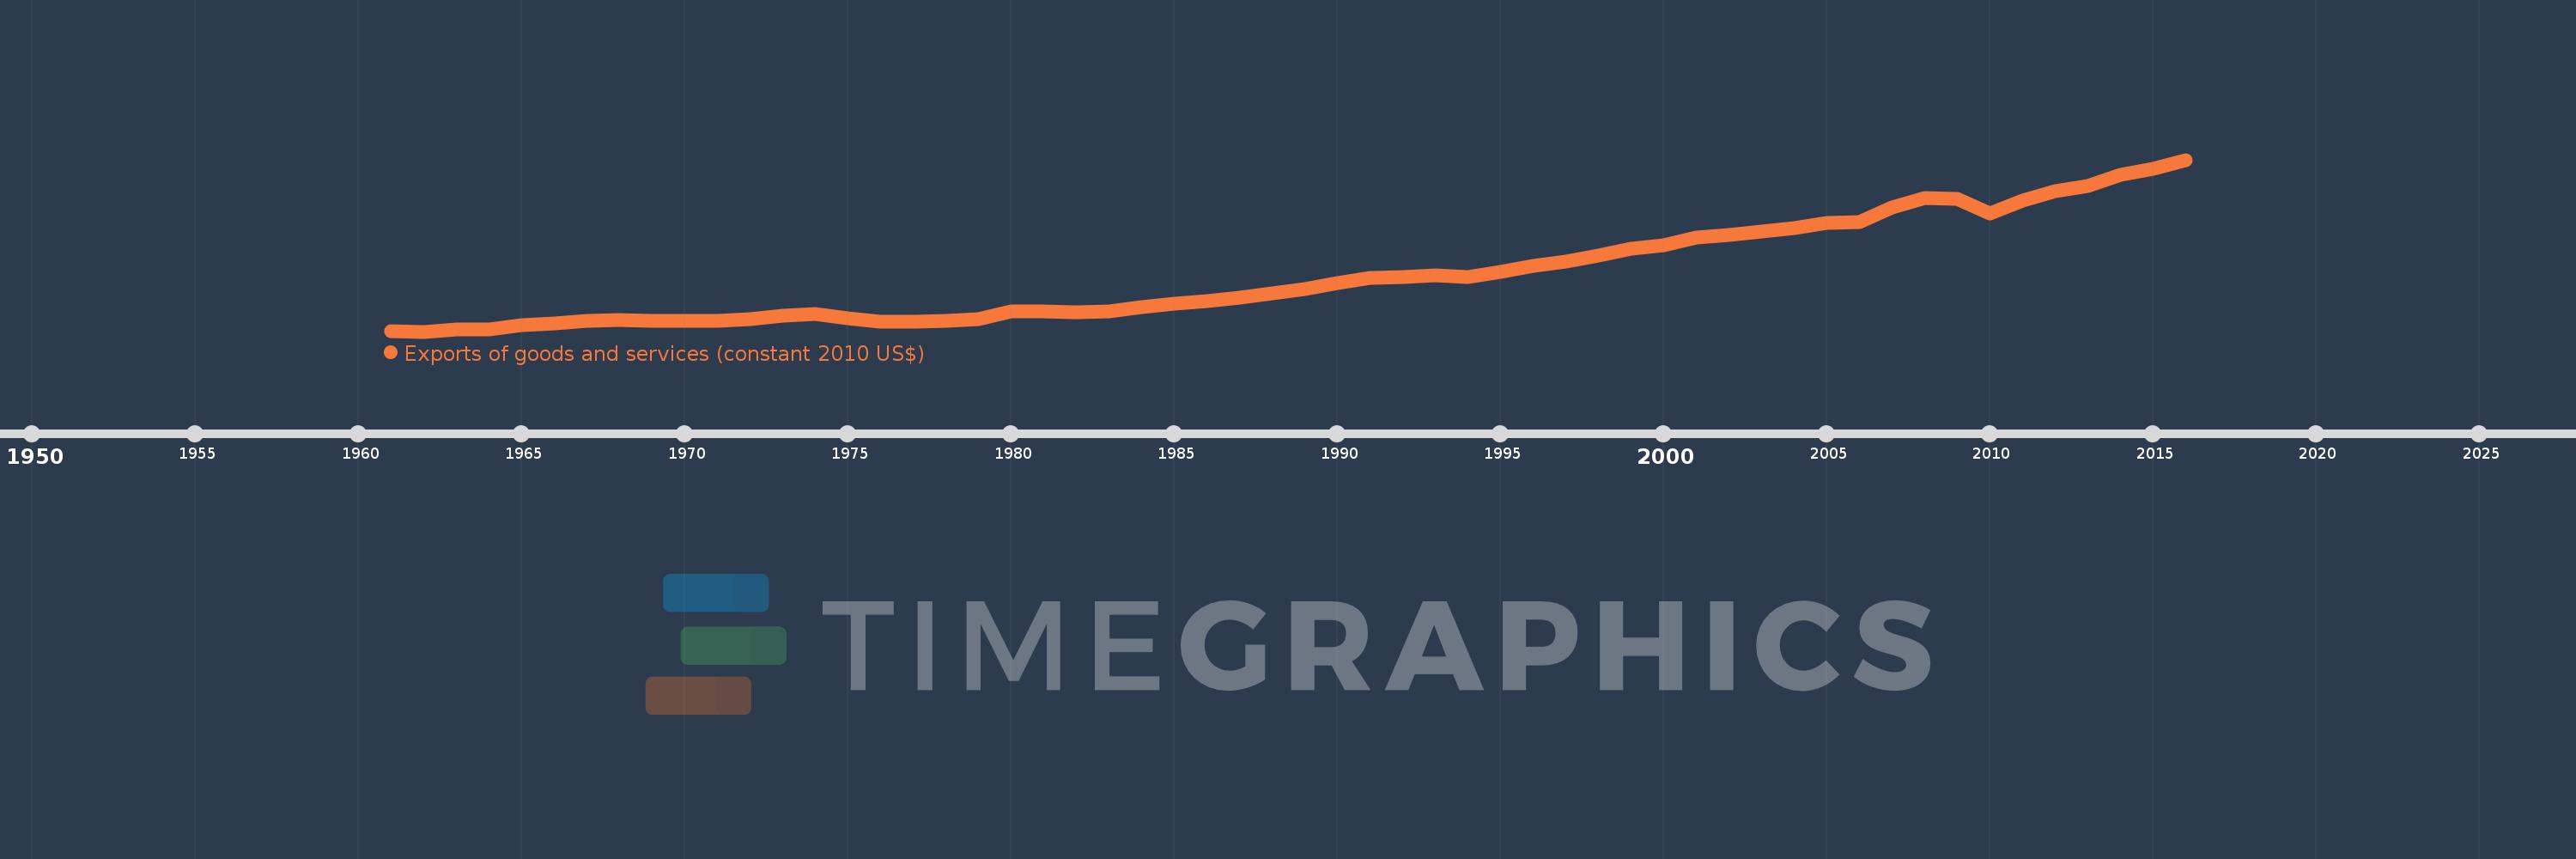
Exports of goods and services (constant 2010 US$)
2016,2015,2014,2013,2012,2011,2010,2009,2008,2007,2006,2005,2004,2003,2002,2001,2000,1999,1998,1997,1996,1995,1994,1993,1992,1991,1990,1989,1988,1987,1986,1985,1984,1983,1982,1981,1980,1979,1978,1977,1976,1975,1974,1973,1972,1971,1970,1969,1968,1967,1966,1965,1964,1963,1962,1961
This statistics in other country:
AfghanistanAlbaniaAlgeriaAngolaAntigua and BarbudaArab WorldArgentinaArmeniaArubaAustraliaAustriaAzerbaijanBahamas, TheBahrainBangladeshBarbadosBelarusBelgiumBelizeBeninBermudaBhutanBoliviaBosnia and HerzegovinaBotswanaBrazilBrunei DarussalamBulgariaBurkina FasoBurundiCabo VerdeCambodiaCameroonCanadaCaribbean small statesCentral African RepublicCentral Europe and the BalticsChadChileChinaColombiaComorosCongo, Dem. Rep.Congo, Rep.Costa RicaCote d'IvoireCroatiaCubaCyprusCzech RepublicDenmarkDominicaDominican RepublicEarly-demographic dividendEast Asia & PacificEast Asia & Pacific (excluding high income)East Asia & Pacific (IDA & IBRD countries)EcuadorEgypt, Arab Rep.El SalvadorEquatorial GuineaEritreaEstoniaEuro areaEurope & Central AsiaEurope & Central Asia (excluding high income)Europe & Central Asia (IDA & IBRD countries)European UnionFaroe IslandsFijiFinlandFragile and conflict affected situationsFranceGabonGambia, TheGeorgiaGermanyGhanaGreeceGrenadaGuatemalaGuineaGuinea-BissauGuyanaHaitiHeavily indebted poor countries (HIPC)High incomeHondurasHong Kong SAR, ChinaHungaryIBRD onlyIcelandIDA & IBRD totalIDA blendIDA onlyIDA totalIndiaIndonesiaIran, Islamic Rep.IraqIrelandIsraelItalyJamaicaJapanJordanKazakhstanKenyaKiribatiKorea, Rep.KosovoKuwaitKyrgyz RepublicLao PDRLate-demographic dividendLatin America & Caribbean Latin America & Caribbean (excluding high income)Latin America & the Caribbean (IDA & IBRD countries)LatviaLeast developed countries: UN classificationLebanonLiberiaLibyaLithuaniaLow & middle incomeLow incomeLower middle incomeLuxembourgMacao SAR, ChinaMacedonia, FYRMadagascarMalawiMalaysiaMaldivesMaliMaltaMauritaniaMauritiusMexicoMiddle East & North AfricaMiddle East & North Africa (excluding high income)Middle East & North Africa (IDA & IBRD countries)Middle incomeMoldovaMongoliaMontenegroMoroccoMozambiqueMyanmarNamibiaNepalNetherlandsNew ZealandNicaraguaNigerNigeriaNorth AmericaNorwayOECD membersOmanOther small statesPacific island small statesPakistanPalauPanamaParaguayPeruPhilippinesPolandPortugalPost-demographic dividendPre-demographic dividendPuerto RicoQatarRomaniaRussian FederationRwandaSamoaSaudi ArabiaSenegalSerbiaSeychellesSierra LeoneSingaporeSlovak RepublicSloveniaSmall statesSolomon IslandsSouth AfricaSouth AsiaSouth Asia (IDA & IBRD)South SudanSpainSri LankaSt. Kitts and NevisSt. LuciaSt. Vincent and the GrenadinesSub-Saharan Africa Sub-Saharan Africa (excluding high income)Sub-Saharan Africa (IDA & IBRD countries)SudanSurinameSwazilandSwedenSwitzerlandTajikistanTanzaniaThailandTimor-LesteTogoTongaTrinidad and TobagoTunisiaTurkeyTurkmenistanUgandaUkraineUnited Arab EmiratesUnited KingdomUnited StatesUpper middle incomeUruguayUzbekistanVanuatuVenezuela, RBVietnamWest Bank and GazaWorldYemen, Rep.ZambiaZimbabwe Timeline:
This timeline shows a graph from 1961 to 2016 of Portugal. No data until 1960. Number of actual observations by date: 56.
Source name:
World Development Indicators
Source organization:
World Bank national accounts data, and OECD National Accounts data files.
Categories, topics:
Economy & Growth, Trade
Last updated:
apr 23, 2017
Indicators value changes by year
Minimum:
4.592 bln
jan 1, 1962
Maximum:
92.185 bln
jan 1, 2016
At the date of observation
Value
Absolute change
Change from previous value
jan 1, 1961
4.69 bln
+4.69 bln
0.0%
jan 1, 1962
4.592 bln
-97.706 mln
-2.08%
jan 1, 1963
5.471 bln
+879.347 mln
19.15%
jan 1, 1964
5.504 bln
+32.57 mln
0.6%
jan 1, 1965
7.727 bln
+2.223 bln
40.38%
jan 1, 1966
8.582 bln
+854.918 mln
11.06%
jan 1, 1967
9.982 bln
+1.401 bln
16.32%
jan 1, 1968
10.34 bln
+357.765 mln
3.58%
jan 1, 1969
9.99 bln
-350.602 mln
-3.39%
jan 1, 1970
10.278 bln
+288.545 mln
2.89%
jan 1, 1971
9.901 bln
-377.013 mln
-3.67%
jan 1, 1972
10.88 bln
+978.677 mln
9.88%
jan 1, 1973
12.898 bln
+2.018 bln
18.55%
jan 1, 1974
13.437 bln
+538.872 mln
4.18%
jan 1, 1975
11.326 bln
-2.111 bln
-15.71%
jan 1, 1976
9.56 bln
-1.766 bln
-15.59%
jan 1, 1977
9.56 bln
0.0
0.0%
jan 1, 1978
10.124 bln
+564.003 mln
5.9%
jan 1, 1979
11.045 bln
+920.617 mln
9.09%
jan 1, 1980
14.686 bln
+3.641 bln
32.97%
jan 1, 1981
15.011 bln
+325.383 mln
2.22%
jan 1, 1982
14.344 bln
-666.951 mln
-4.44%
jan 1, 1983
15.014 bln
+669.715 mln
4.67%
jan 1, 1984
17.057 bln
+2.043 bln
13.61%
jan 1, 1985
19.041 bln
+1.985 bln
11.64%
jan 1, 1986
20.311 bln
+1.269 bln
6.67%
jan 1, 1987
21.683 bln
+1.372 bln
6.76%
jan 1, 1988
24.114 bln
+2.431 bln
11.21%
jan 1, 1989
26.087 bln
+1.973 bln
8.18%
jan 1, 1990
29.271 bln
+3.184 bln
12.2%
jan 1, 1991
32.049 bln
+2.777 bln
9.49%
jan 1, 1992
32.421 bln
+372.416 mln
1.16%
jan 1, 1993
33.471 bln
+1.05 bln
3.24%
jan 1, 1994
32.375 bln
-1.096 bln
-3.27%
jan 1, 1995
35.091 bln
+2.716 bln
8.39%
jan 1, 1996
38.192 bln
+3.101 bln
8.84%
jan 1, 1997
40.447 bln
+2.255 bln
5.9%
jan 1, 1998
43.421 bln
+2.974 bln
7.35%
jan 1, 1999
46.899 bln
+3.478 bln
8.01%
jan 1, 2000
48.596 bln
+1.697 bln
3.62%
jan 1, 2001
52.698 bln
+4.102 bln
8.44%
jan 1, 2002
53.886 bln
+1.187 bln
2.25%
jan 1, 2003
55.545 bln
+1.659 bln
3.08%
jan 1, 2004
57.375 bln
+1.83 bln
3.29%
jan 1, 2005
59.936 bln
+2.561 bln
4.46%
jan 1, 2006
60.227 bln
+291.28 mln
0.49%
jan 1, 2007
67.678 bln
+7.451 bln
12.37%
jan 1, 2008
72.627 bln
+4.949 bln
7.31%
jan 1, 2009
72.393 bln
-234.315 mln
-0.32%
jan 1, 2010
65.004 bln
-7.389 bln
-10.21%
jan 1, 2011
71.193 bln
+6.189 bln
9.52%
jan 1, 2012
76.202 bln
+5.009 bln
7.04%
jan 1, 2013
78.797 bln
+2.595 bln
3.41%
jan 1, 2014
84.302 bln
+5.505 bln
6.99%
jan 1, 2015
87.627 bln
+3.325 bln
3.94%
jan 1, 2016
92.185 bln
+4.559 bln
5.2%
Ranking of countries by current statistics by years


Comments: