29
/
en
AIzaSyAYiBZKx7MnpbEhh9jyipgxe19OcubqV5w
April 1, 2024
223491
Philippines
PHL
true
2
1
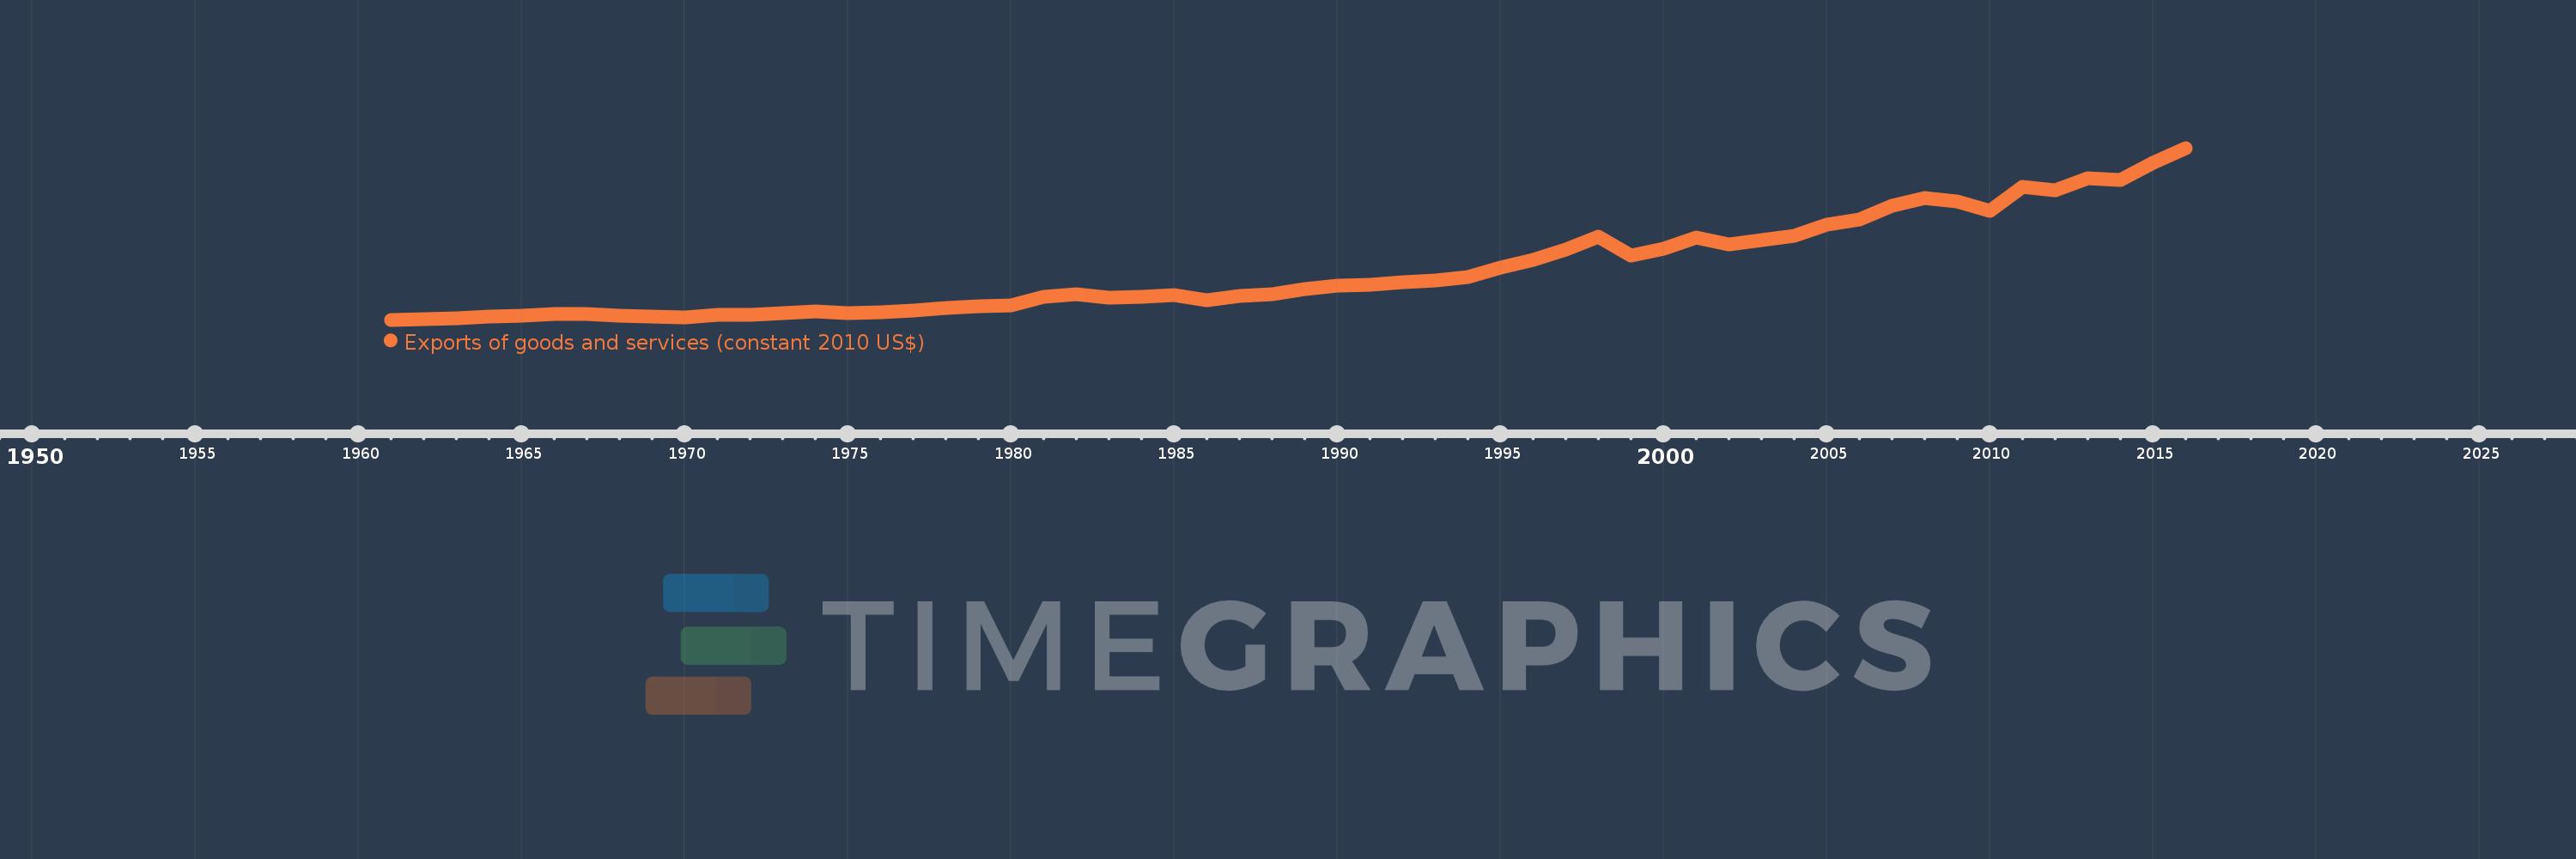
Exports of goods and services (constant 2010 US$)
2016,2015,2014,2013,2012,2011,2010,2009,2008,2007,2006,2005,2004,2003,2002,2001,2000,1999,1998,1997,1996,1995,1994,1993,1992,1991,1990,1989,1988,1987,1986,1985,1984,1983,1982,1981,1980,1979,1978,1977,1976,1975,1974,1973,1972,1971,1970,1969,1968,1967,1966,1965,1964,1963,1962,1961
This statistics in other country:
AfghanistanAlbaniaAlgeriaAngolaAntigua and BarbudaArab WorldArgentinaArmeniaArubaAustraliaAustriaAzerbaijanBahamas, TheBahrainBangladeshBarbadosBelarusBelgiumBelizeBeninBermudaBhutanBoliviaBosnia and HerzegovinaBotswanaBrazilBrunei DarussalamBulgariaBurkina FasoBurundiCabo VerdeCambodiaCameroonCanadaCaribbean small statesCentral African RepublicCentral Europe and the BalticsChadChileChinaColombiaComorosCongo, Dem. Rep.Congo, Rep.Costa RicaCote d'IvoireCroatiaCubaCyprusCzech RepublicDenmarkDominicaDominican RepublicEarly-demographic dividendEast Asia & PacificEast Asia & Pacific (excluding high income)East Asia & Pacific (IDA & IBRD countries)EcuadorEgypt, Arab Rep.El SalvadorEquatorial GuineaEritreaEstoniaEuro areaEurope & Central AsiaEurope & Central Asia (excluding high income)Europe & Central Asia (IDA & IBRD countries)European UnionFaroe IslandsFijiFinlandFragile and conflict affected situationsFranceGabonGambia, TheGeorgiaGermanyGhanaGreeceGrenadaGuatemalaGuineaGuinea-BissauGuyanaHaitiHeavily indebted poor countries (HIPC)High incomeHondurasHong Kong SAR, ChinaHungaryIBRD onlyIcelandIDA & IBRD totalIDA blendIDA onlyIDA totalIndiaIndonesiaIran, Islamic Rep.IraqIrelandIsraelItalyJamaicaJapanJordanKazakhstanKenyaKiribatiKorea, Rep.KosovoKuwaitKyrgyz RepublicLao PDRLate-demographic dividendLatin America & Caribbean Latin America & Caribbean (excluding high income)Latin America & the Caribbean (IDA & IBRD countries)LatviaLeast developed countries: UN classificationLebanonLiberiaLibyaLithuaniaLow & middle incomeLow incomeLower middle incomeLuxembourgMacao SAR, ChinaMacedonia, FYRMadagascarMalawiMalaysiaMaldivesMaliMaltaMauritaniaMauritiusMexicoMiddle East & North AfricaMiddle East & North Africa (excluding high income)Middle East & North Africa (IDA & IBRD countries)Middle incomeMoldovaMongoliaMontenegroMoroccoMozambiqueMyanmarNamibiaNepalNetherlandsNew ZealandNicaraguaNigerNigeriaNorth AmericaNorwayOECD membersOmanOther small statesPacific island small statesPakistanPalauPanamaParaguayPeruPhilippinesPolandPortugalPost-demographic dividendPre-demographic dividendPuerto RicoQatarRomaniaRussian FederationRwandaSamoaSaudi ArabiaSenegalSerbiaSeychellesSierra LeoneSingaporeSlovak RepublicSloveniaSmall statesSolomon IslandsSouth AfricaSouth AsiaSouth Asia (IDA & IBRD)South SudanSpainSri LankaSt. Kitts and NevisSt. LuciaSt. Vincent and the GrenadinesSub-Saharan Africa Sub-Saharan Africa (excluding high income)Sub-Saharan Africa (IDA & IBRD countries)SudanSurinameSwazilandSwedenSwitzerlandTajikistanTanzaniaThailandTimor-LesteTogoTongaTrinidad and TobagoTunisiaTurkeyTurkmenistanUgandaUkraineUnited Arab EmiratesUnited KingdomUnited StatesUpper middle incomeUruguayUzbekistanVanuatuVenezuela, RBVietnamWest Bank and GazaWorldYemen, Rep.ZambiaZimbabwe Timeline:
This timeline shows a graph from 1961 to 2016 of Philippines. No data until 1960. Number of actual observations by date: 56.
Source name:
World Development Indicators
Source organization:
World Bank national accounts data, and OECD National Accounts data files.
Categories, topics:
Economy & Growth, Trade
Last updated:
apr 23, 2017
Indicators value changes by year
Minimum:
3.709 bln
jan 1, 1961
Maximum:
88.599 bln
jan 1, 2016
At the date of observation
Value
Absolute change
Change from previous value
jan 1, 1961
3.709 bln
+3.709 bln
0.0%
jan 1, 1962
3.832 bln
+122.708 mln
3.31%
jan 1, 1963
4.441 bln
+608.923 mln
15.89%
jan 1, 1964
5.288 bln
+847.799 mln
19.09%
jan 1, 1965
5.606 bln
+317.155 mln
6.0%
jan 1, 1966
6.368 bln
+762.115 mln
13.6%
jan 1, 1967
6.756 bln
+388.318 mln
6.1%
jan 1, 1968
5.782 bln
-974.257 mln
-14.42%
jan 1, 1969
5.13 bln
-651.909 mln
-11.28%
jan 1, 1970
4.906 bln
-224.259 mln
-4.37%
jan 1, 1971
5.917 bln
+1.011 bln
20.61%
jan 1, 1972
6.119 bln
+201.949 mln
3.41%
jan 1, 1973
6.883 bln
+764.135 mln
12.49%
jan 1, 1974
7.987 bln
+1.105 bln
16.05%
jan 1, 1975
7.076 bln
-911.365 mln
-11.41%
jan 1, 1976
7.326 bln
+250.032 mln
3.53%
jan 1, 1977
8.266 bln
+939.83 mln
12.83%
jan 1, 1978
9.623 bln
+1.357 bln
16.41%
jan 1, 1979
10.205 bln
+582.67 mln
6.06%
jan 1, 1980
10.643 bln
+438.228 mln
4.29%
jan 1, 1981
14.881 bln
+4.238 bln
39.82%
jan 1, 1982
16.292 bln
+1.41 bln
9.48%
jan 1, 1983
14.551 bln
-1.741 bln
-10.69%
jan 1, 1984
15.052 bln
+501.794 mln
3.45%
jan 1, 1985
15.736 bln
+684.029 mln
4.54%
jan 1, 1986
13.208 bln
-2.529 bln
-16.07%
jan 1, 1987
15.441 bln
+2.234 bln
16.91%
jan 1, 1988
16.495 bln
+1.054 bln
6.83%
jan 1, 1989
18.893 bln
+2.397 bln
14.53%
jan 1, 1990
20.569 bln
+1.676 bln
8.87%
jan 1, 1991
20.951 bln
+382.452 mln
1.86%
jan 1, 1992
22.264 bln
+1.313 bln
6.27%
jan 1, 1993
23.217 bln
+953.582 mln
4.28%
jan 1, 1994
24.662 bln
+1.444 bln
6.22%
jan 1, 1995
29.543 bln
+4.881 bln
19.79%
jan 1, 1996
33.098 bln
+3.556 bln
12.04%
jan 1, 1997
38.197 bln
+5.099 bln
15.4%
jan 1, 1998
44.748 bln
+6.551 bln
17.15%
jan 1, 1999
35.336 bln
-9.412 bln
-21.03%
jan 1, 2000
38.929 bln
+3.593 bln
10.17%
jan 1, 2001
44.271 bln
+5.342 bln
13.72%
jan 1, 2002
41.143 bln
-3.128 bln
-7.07%
jan 1, 2003
43.061 bln
+1.918 bln
4.66%
jan 1, 2004
45.003 bln
+1.942 bln
4.51%
jan 1, 2005
50.746 bln
+5.742 bln
12.76%
jan 1, 2006
53.259 bln
+2.513 bln
4.95%
jan 1, 2007
59.968 bln
+6.709 bln
12.6%
jan 1, 2008
64.015 bln
+4.046 bln
6.75%
jan 1, 2009
62.302 bln
-1.713 bln
-2.68%
jan 1, 2010
57.422 bln
-4.88 bln
-7.83%
jan 1, 2011
69.464 bln
+12.042 bln
20.97%
jan 1, 2012
67.703 bln
-1.761 bln
-2.54%
jan 1, 2013
73.511 bln
+5.808 bln
8.58%
jan 1, 2014
72.798 bln
-713.489 mln
-0.97%
jan 1, 2015
81.302 bln
+8.504 bln
11.68%
jan 1, 2016
88.599 bln
+7.297 bln
8.98%
Ranking of countries by current statistics by years


Comments: