29
/
en
AIzaSyAYiBZKx7MnpbEhh9jyipgxe19OcubqV5w
April 1, 2024
87155
Bolivia
BOL
true
2
1
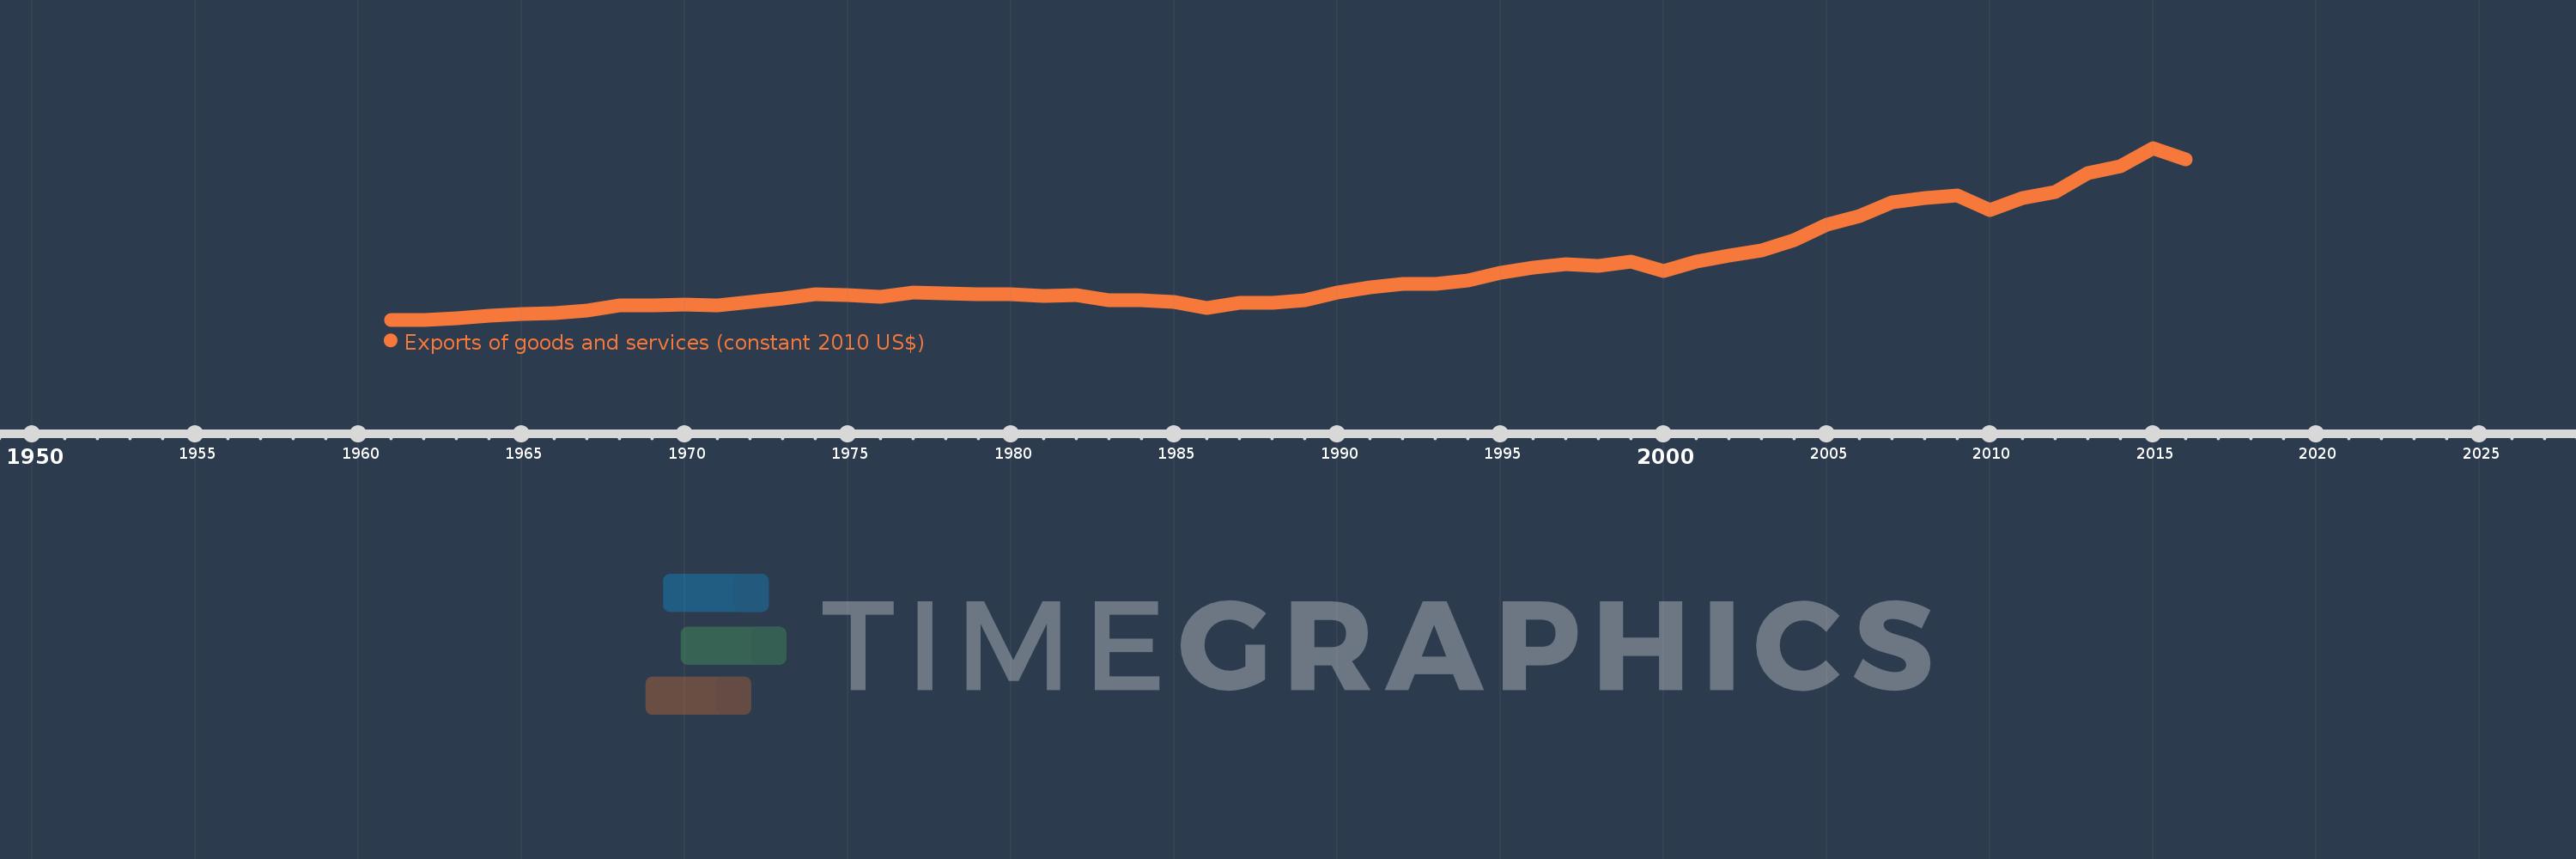
Exports of goods and services (constant 2010 US$)
2016,2015,2014,2013,2012,2011,2010,2009,2008,2007,2006,2005,2004,2003,2002,2001,2000,1999,1998,1997,1996,1995,1994,1993,1992,1991,1990,1989,1988,1987,1986,1985,1984,1983,1982,1981,1980,1979,1978,1977,1976,1975,1974,1973,1972,1971,1970,1969,1968,1967,1966,1965,1964,1963,1962,1961
This statistics in other country:
AfghanistanAlbaniaAlgeriaAngolaAntigua and BarbudaArab WorldArgentinaArmeniaArubaAustraliaAustriaAzerbaijanBahamas, TheBahrainBangladeshBarbadosBelarusBelgiumBelizeBeninBermudaBhutanBoliviaBosnia and HerzegovinaBotswanaBrazilBrunei DarussalamBulgariaBurkina FasoBurundiCabo VerdeCambodiaCameroonCanadaCaribbean small statesCentral African RepublicCentral Europe and the BalticsChadChileChinaColombiaComorosCongo, Dem. Rep.Congo, Rep.Costa RicaCote d'IvoireCroatiaCubaCyprusCzech RepublicDenmarkDominicaDominican RepublicEarly-demographic dividendEast Asia & PacificEast Asia & Pacific (excluding high income)East Asia & Pacific (IDA & IBRD countries)EcuadorEgypt, Arab Rep.El SalvadorEquatorial GuineaEritreaEstoniaEuro areaEurope & Central AsiaEurope & Central Asia (excluding high income)Europe & Central Asia (IDA & IBRD countries)European UnionFaroe IslandsFijiFinlandFragile and conflict affected situationsFranceGabonGambia, TheGeorgiaGermanyGhanaGreeceGrenadaGuatemalaGuineaGuinea-BissauGuyanaHaitiHeavily indebted poor countries (HIPC)High incomeHondurasHong Kong SAR, ChinaHungaryIBRD onlyIcelandIDA & IBRD totalIDA blendIDA onlyIDA totalIndiaIndonesiaIran, Islamic Rep.IraqIrelandIsraelItalyJamaicaJapanJordanKazakhstanKenyaKiribatiKorea, Rep.KosovoKuwaitKyrgyz RepublicLao PDRLate-demographic dividendLatin America & Caribbean Latin America & Caribbean (excluding high income)Latin America & the Caribbean (IDA & IBRD countries)LatviaLeast developed countries: UN classificationLebanonLiberiaLibyaLithuaniaLow & middle incomeLow incomeLower middle incomeLuxembourgMacao SAR, ChinaMacedonia, FYRMadagascarMalawiMalaysiaMaldivesMaliMaltaMauritaniaMauritiusMexicoMiddle East & North AfricaMiddle East & North Africa (excluding high income)Middle East & North Africa (IDA & IBRD countries)Middle incomeMoldovaMongoliaMontenegroMoroccoMozambiqueMyanmarNamibiaNepalNetherlandsNew ZealandNicaraguaNigerNigeriaNorth AmericaNorwayOECD membersOmanOther small statesPacific island small statesPakistanPalauPanamaParaguayPeruPhilippinesPolandPortugalPost-demographic dividendPre-demographic dividendPuerto RicoQatarRomaniaRussian FederationRwandaSamoaSaudi ArabiaSenegalSerbiaSeychellesSierra LeoneSingaporeSlovak RepublicSloveniaSmall statesSolomon IslandsSouth AfricaSouth AsiaSouth Asia (IDA & IBRD)South SudanSpainSri LankaSt. Kitts and NevisSt. LuciaSt. Vincent and the GrenadinesSub-Saharan Africa Sub-Saharan Africa (excluding high income)Sub-Saharan Africa (IDA & IBRD countries)SudanSurinameSwazilandSwedenSwitzerlandTajikistanTanzaniaThailandTimor-LesteTogoTongaTrinidad and TobagoTunisiaTurkeyTurkmenistanUgandaUkraineUnited Arab EmiratesUnited KingdomUnited StatesUpper middle incomeUruguayUzbekistanVanuatuVenezuela, RBVietnamWest Bank and GazaWorldYemen, Rep.ZambiaZimbabwe Timeline:
This timeline shows a graph from 1961 to 2016 of Bolivia. No data until 1960. Number of actual observations by date: 56.
Source name:
World Development Indicators
Source organization:
World Bank national accounts data, and OECD National Accounts data files.
Categories, topics:
Economy & Growth, Trade
Last updated:
apr 23, 2017
Indicators value changes by year
Minimum:
863.884 mln
jan 1, 1961
Maximum:
11.068 bln
jan 1, 2015
At the date of observation
Value
Absolute change
Change from previous value
jan 1, 1961
863.884 mln
+863.884 mln
0.0%
jan 1, 1962
868.959 mln
+5.074 mln
0.59%
jan 1, 1963
937.461 mln
+68.502 mln
7.88%
jan 1, 1964
1.115 bln
+177.824 mln
18.97%
jan 1, 1965
1.19 bln
+74.237 mln
6.66%
jan 1, 1966
1.235 bln
+45.751 mln
3.85%
jan 1, 1967
1.398 bln
+163.149 mln
13.21%
jan 1, 1968
1.732 bln
+333.204 mln
23.83%
jan 1, 1969
1.74 bln
+8.632 mln
0.5%
jan 1, 1970
1.787 bln
+46.614 mln
2.68%
jan 1, 1971
1.728 bln
-58.941 mln
-3.3%
jan 1, 1972
1.928 bln
+199.591 mln
11.55%
jan 1, 1973
2.128 bln
+200.821 mln
10.42%
jan 1, 1974
2.367 bln
+239.032 mln
11.23%
jan 1, 1975
2.344 bln
-23.664 mln
-1.0%
jan 1, 1976
2.241 bln
-103.124 mln
-4.4%
jan 1, 1977
2.482 bln
+241.058 mln
10.76%
jan 1, 1978
2.432 bln
-49.862 mln
-2.01%
jan 1, 1979
2.359 bln
-72.73 mln
-2.99%
jan 1, 1980
2.396 bln
+36.763 mln
1.56%
jan 1, 1981
2.281 bln
-114.703 mln
-4.79%
jan 1, 1982
2.311 bln
+29.495 mln
1.29%
jan 1, 1983
2.007 bln
-303.193 mln
-13.12%
jan 1, 1984
2.046 bln
+38.227 mln
1.9%
jan 1, 1985
1.922 bln
-124.078 mln
-6.07%
jan 1, 1986
1.561 bln
-360.141 mln
-18.74%
jan 1, 1987
1.86 bln
+298.74 mln
19.13%
jan 1, 1988
1.881 bln
+20.552 mln
1.1%
jan 1, 1989
2.007 bln
+126.176 mln
6.71%
jan 1, 1990
2.501 bln
+493.89 mln
24.61%
jan 1, 1991
2.778 bln
+276.797 mln
11.07%
jan 1, 1992
2.98 bln
+202.591 mln
7.29%
jan 1, 1993
3.013 bln
+33.164 mln
1.11%
jan 1, 1994
3.173 bln
+159.845 mln
5.3%
jan 1, 1995
3.652 bln
+479.039 mln
15.1%
jan 1, 1996
3.985 bln
+333.02 mln
9.12%
jan 1, 1997
4.147 bln
+162.146 mln
4.07%
jan 1, 1998
4.06 bln
-87.518 mln
-2.11%
jan 1, 1999
4.323 bln
+263.178 mln
6.48%
jan 1, 2000
3.769 bln
-553.556 mln
-12.8%
jan 1, 2001
4.336 bln
+566.953 mln
15.04%
jan 1, 2002
4.7 bln
+363.274 mln
8.38%
jan 1, 2003
4.967 bln
+267.566 mln
5.69%
jan 1, 2004
5.571 bln
+604.172 mln
12.16%
jan 1, 2005
6.497 bln
+926.005 mln
16.62%
jan 1, 2006
7.039 bln
+541.648 mln
8.34%
jan 1, 2007
7.837 bln
+798.011 mln
11.34%
jan 1, 2008
8.079 bln
+241.794 mln
3.09%
jan 1, 2009
8.255 bln
+176.092 mln
2.18%
jan 1, 2010
7.367 bln
-888.356 mln
-10.76%
jan 1, 2011
8.093 bln
+726.478 mln
9.86%
jan 1, 2012
8.464 bln
+371.135 mln
4.59%
jan 1, 2013
9.59 bln
+1.126 bln
13.3%
jan 1, 2014
9.983 bln
+392.456 mln
4.09%
jan 1, 2015
11.068 bln
+1.085 bln
10.87%
jan 1, 2016
10.412 bln
-655.409 mln
-5.92%
Ranking of countries by current statistics by years


Comments: