29
/
en
AIzaSyAYiBZKx7MnpbEhh9jyipgxe19OcubqV5w
April 1, 2024
240402
Singapore
SGP
true
2
1
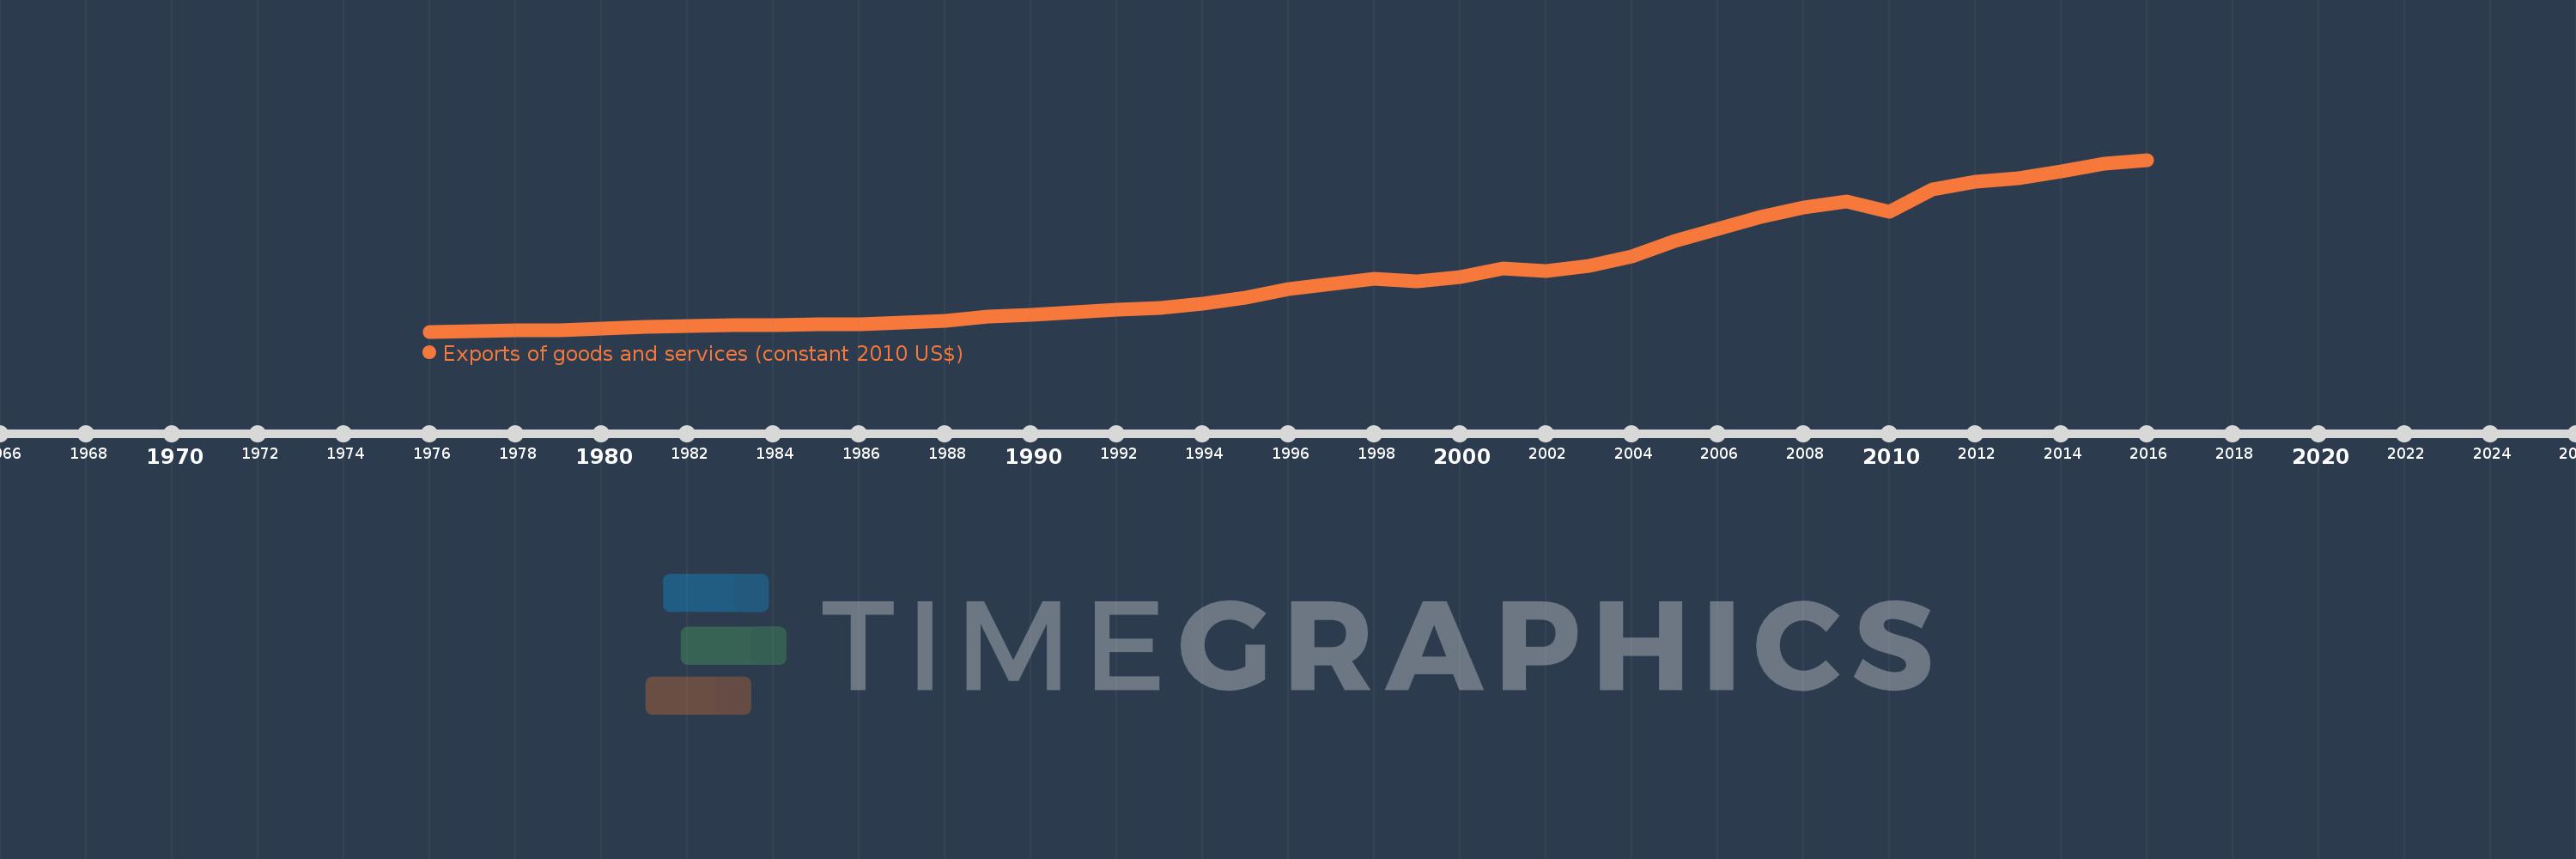
Exports of goods and services (constant 2010 US$)
2016,2015,2014,2013,2012,2011,2010,2009,2008,2007,2006,2005,2004,2003,2002,2001,2000,1999,1998,1997,1996,1995,1994,1993,1992,1991,1990,1989,1988,1987,1986,1985,1984,1983,1982,1981,1980,1979,1978,1977,1976
This statistics in other country:
AfghanistanAlbaniaAlgeriaAngolaAntigua and BarbudaArab WorldArgentinaArmeniaArubaAustraliaAustriaAzerbaijanBahamas, TheBahrainBangladeshBarbadosBelarusBelgiumBelizeBeninBermudaBhutanBoliviaBosnia and HerzegovinaBotswanaBrazilBrunei DarussalamBulgariaBurkina FasoBurundiCabo VerdeCambodiaCameroonCanadaCaribbean small statesCentral African RepublicCentral Europe and the BalticsChadChileChinaColombiaComorosCongo, Dem. Rep.Congo, Rep.Costa RicaCote d'IvoireCroatiaCubaCyprusCzech RepublicDenmarkDominicaDominican RepublicEarly-demographic dividendEast Asia & PacificEast Asia & Pacific (excluding high income)East Asia & Pacific (IDA & IBRD countries)EcuadorEgypt, Arab Rep.El SalvadorEquatorial GuineaEritreaEstoniaEuro areaEurope & Central AsiaEurope & Central Asia (excluding high income)Europe & Central Asia (IDA & IBRD countries)European UnionFaroe IslandsFijiFinlandFragile and conflict affected situationsFranceGabonGambia, TheGeorgiaGermanyGhanaGreeceGrenadaGuatemalaGuineaGuinea-BissauGuyanaHaitiHeavily indebted poor countries (HIPC)High incomeHondurasHong Kong SAR, ChinaHungaryIBRD onlyIcelandIDA & IBRD totalIDA blendIDA onlyIDA totalIndiaIndonesiaIran, Islamic Rep.IraqIrelandIsraelItalyJamaicaJapanJordanKazakhstanKenyaKiribatiKorea, Rep.KosovoKuwaitKyrgyz RepublicLao PDRLate-demographic dividendLatin America & Caribbean Latin America & Caribbean (excluding high income)Latin America & the Caribbean (IDA & IBRD countries)LatviaLeast developed countries: UN classificationLebanonLiberiaLibyaLithuaniaLow & middle incomeLow incomeLower middle incomeLuxembourgMacao SAR, ChinaMacedonia, FYRMadagascarMalawiMalaysiaMaldivesMaliMaltaMauritaniaMauritiusMexicoMiddle East & North AfricaMiddle East & North Africa (excluding high income)Middle East & North Africa (IDA & IBRD countries)Middle incomeMoldovaMongoliaMontenegroMoroccoMozambiqueMyanmarNamibiaNepalNetherlandsNew ZealandNicaraguaNigerNigeriaNorth AmericaNorwayOECD membersOmanOther small statesPacific island small statesPakistanPalauPanamaParaguayPeruPhilippinesPolandPortugalPost-demographic dividendPre-demographic dividendPuerto RicoQatarRomaniaRussian FederationRwandaSamoaSaudi ArabiaSenegalSerbiaSeychellesSierra LeoneSingaporeSlovak RepublicSloveniaSmall statesSolomon IslandsSouth AfricaSouth AsiaSouth Asia (IDA & IBRD)South SudanSpainSri LankaSt. Kitts and NevisSt. LuciaSt. Vincent and the GrenadinesSub-Saharan Africa Sub-Saharan Africa (excluding high income)Sub-Saharan Africa (IDA & IBRD countries)SudanSurinameSwazilandSwedenSwitzerlandTajikistanTanzaniaThailandTimor-LesteTogoTongaTrinidad and TobagoTunisiaTurkeyTurkmenistanUgandaUkraineUnited Arab EmiratesUnited KingdomUnited StatesUpper middle incomeUruguayUzbekistanVanuatuVenezuela, RBVietnamWest Bank and GazaWorldYemen, Rep.ZambiaZimbabwe Timeline:
This timeline shows a graph from 1976 to 2016 of Singapore. No data until 1975. Number of actual observations by date: 41.
Source name:
World Development Indicators
Source organization:
World Bank national accounts data, and OECD National Accounts data files.
Categories, topics:
Economy & Growth, Trade
Last updated:
apr 23, 2017
Indicators value changes by year
Minimum:
13.474 bln
jan 1, 1976
Maximum:
567.539 bln
jan 1, 2016
At the date of observation
Value
Absolute change
Change from previous value
jan 1, 1976
13.474 bln
+13.474 bln
0.0%
jan 1, 1977
14.958 bln
+1.484 bln
11.01%
jan 1, 1978
17.013 bln
+2.055 bln
13.74%
jan 1, 1979
18.939 bln
+1.927 bln
11.32%
jan 1, 1980
23.396 bln
+4.456 bln
23.53%
jan 1, 1981
28.554 bln
+5.159 bln
22.05%
jan 1, 1982
31.965 bln
+3.41 bln
11.94%
jan 1, 1983
33.614 bln
+1.65 bln
5.16%
jan 1, 1984
35.444 bln
+1.829 bln
5.44%
jan 1, 1985
38.339 bln
+2.895 bln
8.17%
jan 1, 1986
37.067 bln
-1.273 bln
-3.32%
jan 1, 1987
41.833 bln
+4.766 bln
12.86%
jan 1, 1988
47.71 bln
+5.877 bln
14.05%
jan 1, 1989
61.944 bln
+14.234 bln
29.83%
jan 1, 1990
67.969 bln
+6.025 bln
9.73%
jan 1, 1991
76.752 bln
+8.783 bln
12.92%
jan 1, 1992
83.345 bln
+6.593 bln
8.59%
jan 1, 1993
89.36 bln
+6.016 bln
7.22%
jan 1, 1994
104.644 bln
+15.284 bln
17.1%
jan 1, 1995
124.203 bln
+19.558 bln
18.69%
jan 1, 1996
151.785 bln
+27.582 bln
22.21%
jan 1, 1997
166.351 bln
+14.566 bln
9.6%
jan 1, 1998
183.543 bln
+17.192 bln
10.33%
jan 1, 1999
175.491 bln
-8.052 bln
-4.39%
jan 1, 2000
189.226 bln
+13.735 bln
7.83%
jan 1, 2001
216.531 bln
+27.305 bln
14.43%
jan 1, 2002
208.871 bln
-7.66 bln
-3.54%
jan 1, 2003
224.527 bln
+15.656 bln
7.5%
jan 1, 2004
256.435 bln
+31.908 bln
14.21%
jan 1, 2005
305.324 bln
+48.889 bln
19.06%
jan 1, 2006
343.422 bln
+38.098 bln
12.48%
jan 1, 2007
381.963 bln
+38.542 bln
11.22%
jan 1, 2008
414.772 bln
+32.809 bln
8.59%
jan 1, 2009
433.756 bln
+18.984 bln
4.58%
jan 1, 2010
401.256 bln
-32.5 bln
-7.49%
jan 1, 2011
471.092 bln
+69.835 bln
17.4%
jan 1, 2012
497.597 bln
+26.506 bln
5.63%
jan 1, 2013
506.67 bln
+9.073 bln
1.82%
jan 1, 2014
531.153 bln
+24.483 bln
4.83%
jan 1, 2015
553.864 bln
+22.711 bln
4.28%
jan 1, 2016
567.539 bln
+13.675 bln
2.47%
Ranking of countries by current statistics by years


Comments: