29
/
en
AIzaSyAYiBZKx7MnpbEhh9jyipgxe19OcubqV5w
April 1, 2024
139211
Germany
DEU
true
2
1
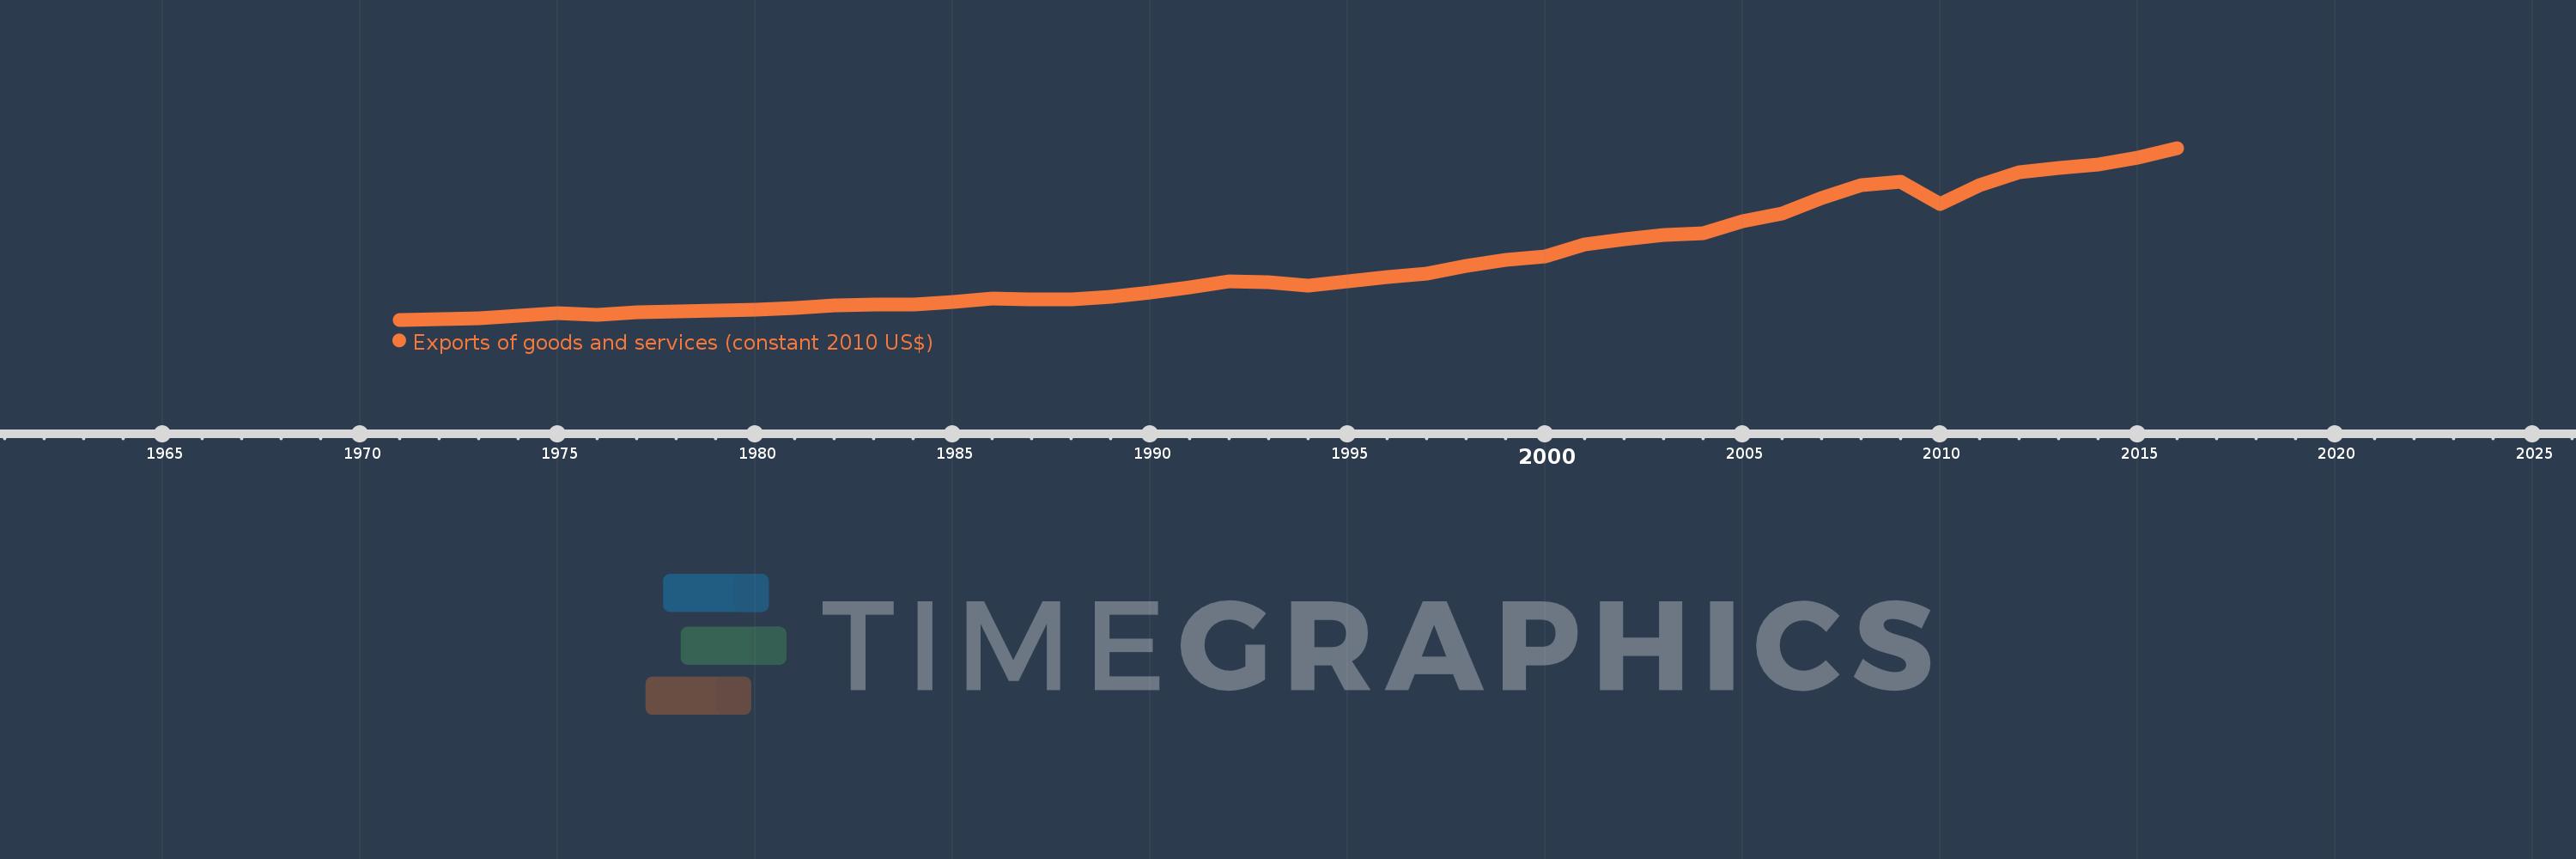
Exports of goods and services (constant 2010 US$)
2016,2015,2014,2013,2012,2011,2010,2009,2008,2007,2006,2005,2004,2003,2002,2001,2000,1999,1998,1997,1996,1995,1994,1993,1992,1991,1990,1989,1988,1987,1986,1985,1984,1983,1982,1981,1980,1979,1978,1977,1976,1975,1974,1973,1972,1971
This statistics in other country:
AfghanistanAlbaniaAlgeriaAngolaAntigua and BarbudaArab WorldArgentinaArmeniaArubaAustraliaAustriaAzerbaijanBahamas, TheBahrainBangladeshBarbadosBelarusBelgiumBelizeBeninBermudaBhutanBoliviaBosnia and HerzegovinaBotswanaBrazilBrunei DarussalamBulgariaBurkina FasoBurundiCabo VerdeCambodiaCameroonCanadaCaribbean small statesCentral African RepublicCentral Europe and the BalticsChadChileChinaColombiaComorosCongo, Dem. Rep.Congo, Rep.Costa RicaCote d'IvoireCroatiaCubaCyprusCzech RepublicDenmarkDominicaDominican RepublicEarly-demographic dividendEast Asia & PacificEast Asia & Pacific (excluding high income)East Asia & Pacific (IDA & IBRD countries)EcuadorEgypt, Arab Rep.El SalvadorEquatorial GuineaEritreaEstoniaEuro areaEurope & Central AsiaEurope & Central Asia (excluding high income)Europe & Central Asia (IDA & IBRD countries)European UnionFaroe IslandsFijiFinlandFragile and conflict affected situationsFranceGabonGambia, TheGeorgiaGermanyGhanaGreeceGrenadaGuatemalaGuineaGuinea-BissauGuyanaHaitiHeavily indebted poor countries (HIPC)High incomeHondurasHong Kong SAR, ChinaHungaryIBRD onlyIcelandIDA & IBRD totalIDA blendIDA onlyIDA totalIndiaIndonesiaIran, Islamic Rep.IraqIrelandIsraelItalyJamaicaJapanJordanKazakhstanKenyaKiribatiKorea, Rep.KosovoKuwaitKyrgyz RepublicLao PDRLate-demographic dividendLatin America & Caribbean Latin America & Caribbean (excluding high income)Latin America & the Caribbean (IDA & IBRD countries)LatviaLeast developed countries: UN classificationLebanonLiberiaLibyaLithuaniaLow & middle incomeLow incomeLower middle incomeLuxembourgMacao SAR, ChinaMacedonia, FYRMadagascarMalawiMalaysiaMaldivesMaliMaltaMauritaniaMauritiusMexicoMiddle East & North AfricaMiddle East & North Africa (excluding high income)Middle East & North Africa (IDA & IBRD countries)Middle incomeMoldovaMongoliaMontenegroMoroccoMozambiqueMyanmarNamibiaNepalNetherlandsNew ZealandNicaraguaNigerNigeriaNorth AmericaNorwayOECD membersOmanOther small statesPacific island small statesPakistanPalauPanamaParaguayPeruPhilippinesPolandPortugalPost-demographic dividendPre-demographic dividendPuerto RicoQatarRomaniaRussian FederationRwandaSamoaSaudi ArabiaSenegalSerbiaSeychellesSierra LeoneSingaporeSlovak RepublicSloveniaSmall statesSolomon IslandsSouth AfricaSouth AsiaSouth Asia (IDA & IBRD)South SudanSpainSri LankaSt. Kitts and NevisSt. LuciaSt. Vincent and the GrenadinesSub-Saharan Africa Sub-Saharan Africa (excluding high income)Sub-Saharan Africa (IDA & IBRD countries)SudanSurinameSwazilandSwedenSwitzerlandTajikistanTanzaniaThailandTimor-LesteTogoTongaTrinidad and TobagoTunisiaTurkeyTurkmenistanUgandaUkraineUnited Arab EmiratesUnited KingdomUnited StatesUpper middle incomeUruguayUzbekistanVanuatuVenezuela, RBVietnamWest Bank and GazaWorldYemen, Rep.ZambiaZimbabwe Timeline:
This timeline shows a graph from 1971 to 2016 of Germany. No data until 1970. Number of actual observations by date: 46.
Source name:
World Development Indicators
Source organization:
World Bank national accounts data, and OECD National Accounts data files.
Categories, topics:
Economy & Growth, Trade
Last updated:
apr 23, 2017
Indicators value changes by year
Minimum:
174.175 bln
jan 1, 1971
Maximum:
1.792 trl
jan 1, 2016
At the date of observation
Value
Absolute change
Change from previous value
jan 1, 1971
174.175 bln
+174.175 bln
0.0%
jan 1, 1972
178.275 bln
+4.1 bln
2.35%
jan 1, 1973
189.297 bln
+11.022 bln
6.18%
jan 1, 1974
209.585 bln
+20.288 bln
10.72%
jan 1, 1975
234.292 bln
+24.707 bln
11.79%
jan 1, 1976
219.915 bln
-14.377 bln
-6.14%
jan 1, 1977
242.545 bln
+22.63 bln
10.29%
jan 1, 1978
252.236 bln
+9.691 bln
4.0%
jan 1, 1979
259.212 bln
+6.975 bln
2.77%
jan 1, 1980
272.098 bln
+12.886 bln
4.97%
jan 1, 1981
286.954 bln
+14.856 bln
5.46%
jan 1, 1982
307.668 bln
+20.714 bln
7.22%
jan 1, 1983
319.063 bln
+11.395 bln
3.7%
jan 1, 1984
317.465 bln
-1.597 bln
-0.5%
jan 1, 1985
345.58 bln
+28.115 bln
8.86%
jan 1, 1986
371.352 bln
+25.772 bln
7.46%
jan 1, 1987
366.933 bln
-4.42 bln
-1.19%
jan 1, 1988
369.648 bln
+2.716 bln
0.74%
jan 1, 1989
390.575 bln
+20.927 bln
5.66%
jan 1, 1990
430.724 bln
+40.149 bln
10.28%
jan 1, 1991
479.606 bln
+48.882 bln
11.35%
jan 1, 1992
532.481 bln
+52.875 bln
11.02%
jan 1, 1993
530.604 bln
-1.877 bln
-0.35%
jan 1, 1994
499.129 bln
-31.475 bln
-5.93%
jan 1, 1995
538.257 bln
+39.128 bln
7.84%
jan 1, 1996
573.63 bln
+35.374 bln
6.57%
jan 1, 1997
607.271 bln
+33.641 bln
5.86%
jan 1, 1998
681.772 bln
+74.501 bln
12.27%
jan 1, 1999
734.183 bln
+52.411 bln
7.69%
jan 1, 2000
773.455 bln
+39.272 bln
5.35%
jan 1, 2001
880.442 bln
+106.987 bln
13.83%
jan 1, 2002
930.687 bln
+50.245 bln
5.71%
jan 1, 2003
970.248 bln
+39.561 bln
4.25%
jan 1, 2004
988.729 bln
+18.481 bln
1.9%
jan 1, 2005
1.102 trl
+113.196 bln
11.45%
jan 1, 2006
1.175 trl
+73.346 bln
6.66%
jan 1, 2007
1.32 trl
+144.382 bln
12.29%
jan 1, 2008
1.443 trl
+122.869 bln
9.31%
jan 1, 2009
1.47 trl
+27.866 bln
1.93%
jan 1, 2010
1.261 trl
-209.787 bln
-14.27%
jan 1, 2011
1.444 trl
+183.221 bln
14.53%
jan 1, 2012
1.563 trl
+119.548 bln
8.28%
jan 1, 2013
1.608 trl
+44.181 bln
2.83%
jan 1, 2014
1.637 trl
+29.743 bln
1.85%
jan 1, 2015
1.704 trl
+66.849 bln
4.08%
jan 1, 2016
1.792 trl
+87.929 bln
5.16%
Ranking of countries by current statistics by years


Comments: