29
/
en
AIzaSyAYiBZKx7MnpbEhh9jyipgxe19OcubqV5w
April 1, 2024
241535
Slovak Republic
SVK
true
2
1
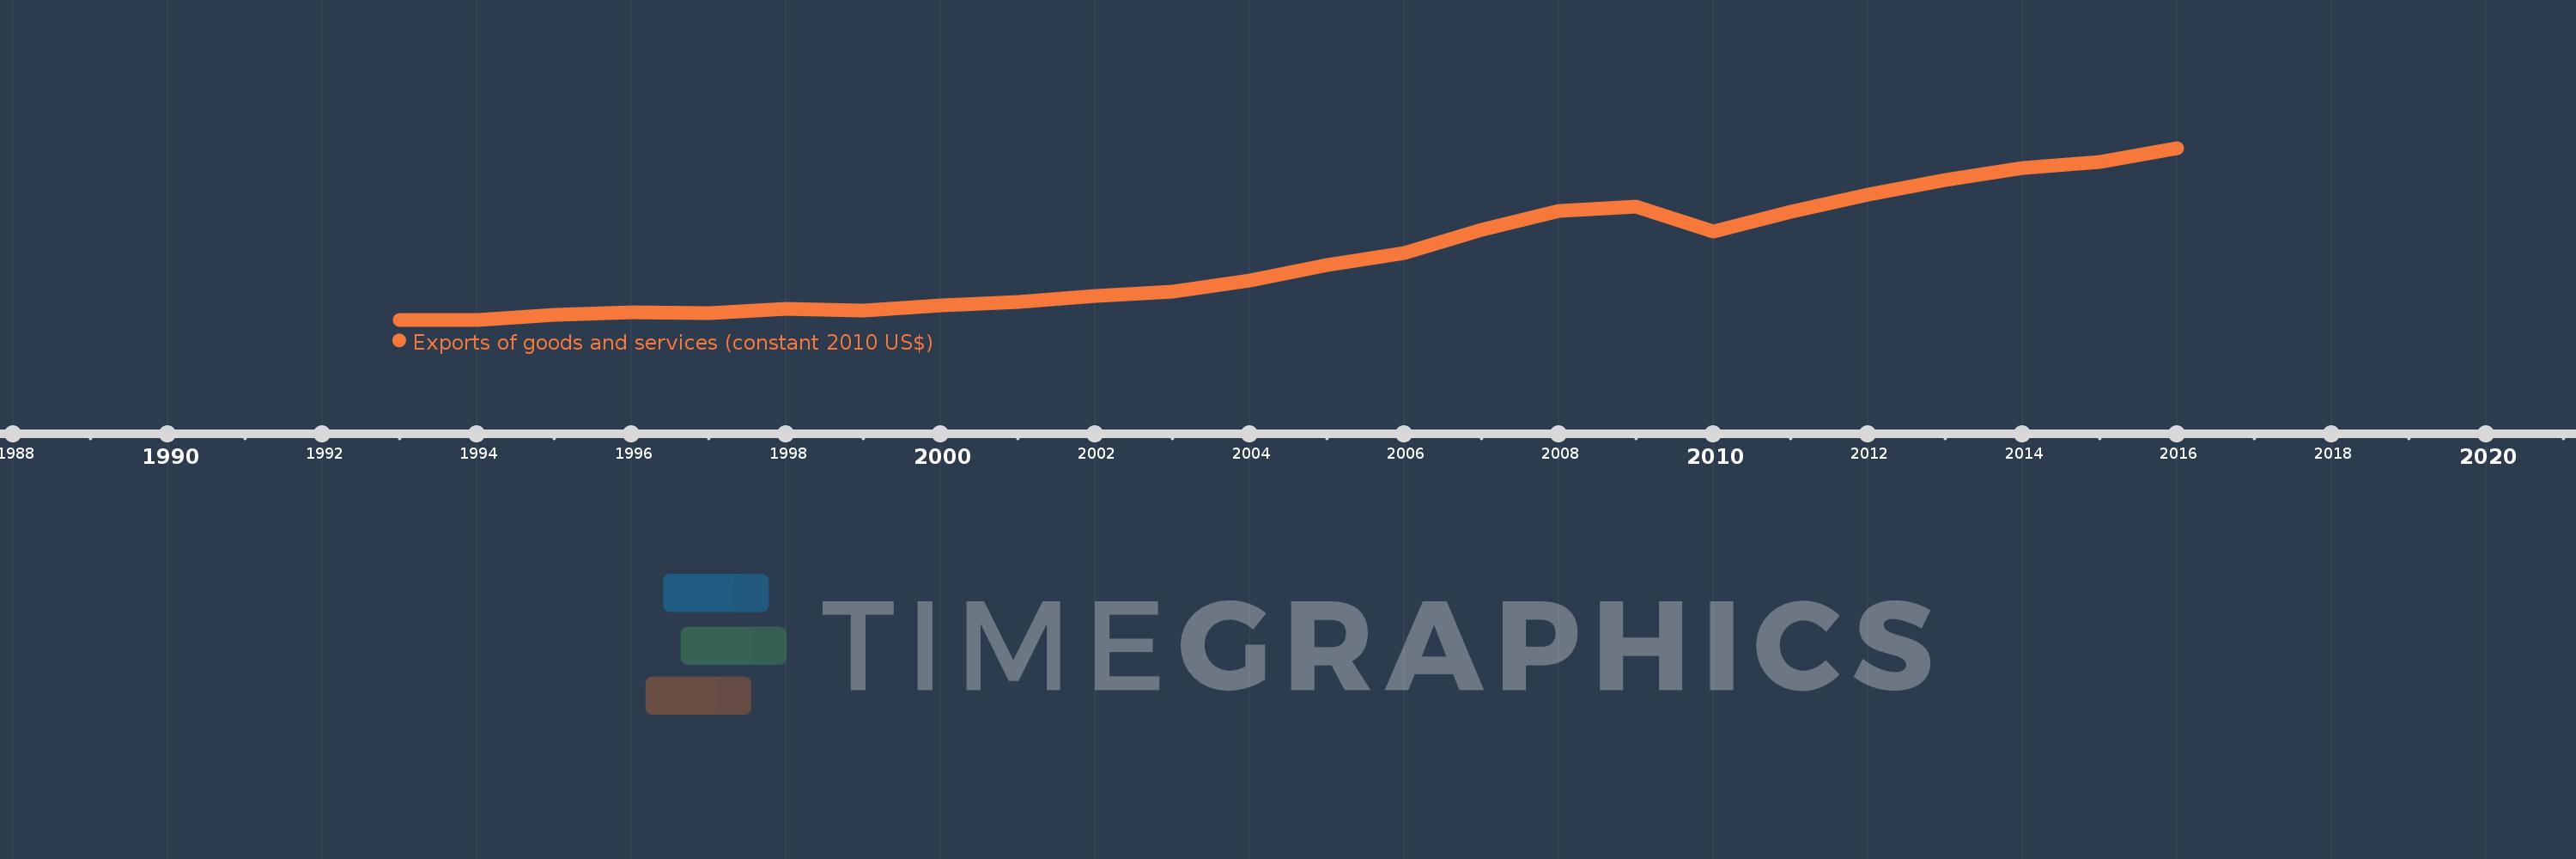
Exports of goods and services (constant 2010 US$)
2016,2015,2014,2013,2012,2011,2010,2009,2008,2007,2006,2005,2004,2003,2002,2001,2000,1999,1998,1997,1996,1995,1994,1993
This statistics in other country:
AfghanistanAlbaniaAlgeriaAngolaAntigua and BarbudaArab WorldArgentinaArmeniaArubaAustraliaAustriaAzerbaijanBahamas, TheBahrainBangladeshBarbadosBelarusBelgiumBelizeBeninBermudaBhutanBoliviaBosnia and HerzegovinaBotswanaBrazilBrunei DarussalamBulgariaBurkina FasoBurundiCabo VerdeCambodiaCameroonCanadaCaribbean small statesCentral African RepublicCentral Europe and the BalticsChadChileChinaColombiaComorosCongo, Dem. Rep.Congo, Rep.Costa RicaCote d'IvoireCroatiaCubaCyprusCzech RepublicDenmarkDominicaDominican RepublicEarly-demographic dividendEast Asia & PacificEast Asia & Pacific (excluding high income)East Asia & Pacific (IDA & IBRD countries)EcuadorEgypt, Arab Rep.El SalvadorEquatorial GuineaEritreaEstoniaEuro areaEurope & Central AsiaEurope & Central Asia (excluding high income)Europe & Central Asia (IDA & IBRD countries)European UnionFaroe IslandsFijiFinlandFragile and conflict affected situationsFranceGabonGambia, TheGeorgiaGermanyGhanaGreeceGrenadaGuatemalaGuineaGuinea-BissauGuyanaHaitiHeavily indebted poor countries (HIPC)High incomeHondurasHong Kong SAR, ChinaHungaryIBRD onlyIcelandIDA & IBRD totalIDA blendIDA onlyIDA totalIndiaIndonesiaIran, Islamic Rep.IraqIrelandIsraelItalyJamaicaJapanJordanKazakhstanKenyaKiribatiKorea, Rep.KosovoKuwaitKyrgyz RepublicLao PDRLate-demographic dividendLatin America & Caribbean Latin America & Caribbean (excluding high income)Latin America & the Caribbean (IDA & IBRD countries)LatviaLeast developed countries: UN classificationLebanonLiberiaLibyaLithuaniaLow & middle incomeLow incomeLower middle incomeLuxembourgMacao SAR, ChinaMacedonia, FYRMadagascarMalawiMalaysiaMaldivesMaliMaltaMauritaniaMauritiusMexicoMiddle East & North AfricaMiddle East & North Africa (excluding high income)Middle East & North Africa (IDA & IBRD countries)Middle incomeMoldovaMongoliaMontenegroMoroccoMozambiqueMyanmarNamibiaNepalNetherlandsNew ZealandNicaraguaNigerNigeriaNorth AmericaNorwayOECD membersOmanOther small statesPacific island small statesPakistanPalauPanamaParaguayPeruPhilippinesPolandPortugalPost-demographic dividendPre-demographic dividendPuerto RicoQatarRomaniaRussian FederationRwandaSamoaSaudi ArabiaSenegalSerbiaSeychellesSierra LeoneSingaporeSlovak RepublicSloveniaSmall statesSolomon IslandsSouth AfricaSouth AsiaSouth Asia (IDA & IBRD)South SudanSpainSri LankaSt. Kitts and NevisSt. LuciaSt. Vincent and the GrenadinesSub-Saharan Africa Sub-Saharan Africa (excluding high income)Sub-Saharan Africa (IDA & IBRD countries)SudanSurinameSwazilandSwedenSwitzerlandTajikistanTanzaniaThailandTimor-LesteTogoTongaTrinidad and TobagoTunisiaTurkeyTurkmenistanUgandaUkraineUnited Arab EmiratesUnited KingdomUnited StatesUpper middle incomeUruguayUzbekistanVanuatuVenezuela, RBVietnamWest Bank and GazaWorldYemen, Rep.ZambiaZimbabwe Timeline:
This timeline shows a graph from 1993 to 2016 of Slovak Republic. No data until 1992. Number of actual observations by date: 24.
Source name:
World Development Indicators
Source organization:
World Bank national accounts data, and OECD National Accounts data files.
Categories, topics:
Economy & Growth, Trade
Last updated:
apr 23, 2017
Indicators value changes by year
Minimum:
17.035 bln
jan 1, 1994
Maximum:
98.966 bln
jan 1, 2016
At the date of observation
Value
Absolute change
Change from previous value
jan 1, 1993
17.078 bln
+17.078 bln
0.0%
jan 1, 1994
17.035 bln
-43.369 mln
-0.25%
jan 1, 1995
19.549 bln
+2.514 bln
14.76%
jan 1, 1996
20.438 bln
+889.091 mln
4.55%
jan 1, 1997
20.154 bln
-284.372 mln
-1.39%
jan 1, 1998
22.168 bln
+2.014 bln
9.99%
jan 1, 1999
21.589 bln
-578.849 mln
-2.61%
jan 1, 2000
23.771 bln
+2.183 bln
10.11%
jan 1, 2001
25.552 bln
+1.78 bln
7.49%
jan 1, 2002
28.269 bln
+2.718 bln
10.64%
jan 1, 2003
30.259 bln
+1.99 bln
7.04%
jan 1, 2004
35.825 bln
+5.566 bln
18.39%
jan 1, 2005
43.297 bln
+7.472 bln
20.86%
jan 1, 2006
48.873 bln
+5.577 bln
12.88%
jan 1, 2007
60.075 bln
+11.201 bln
22.92%
jan 1, 2008
68.847 bln
+8.772 bln
14.6%
jan 1, 2009
70.925 bln
+2.079 bln
3.02%
jan 1, 2010
59.036 bln
-11.89 bln
-16.76%
jan 1, 2011
68.325 bln
+9.289 bln
15.73%
jan 1, 2012
76.529 bln
+8.204 bln
12.01%
jan 1, 2013
83.651 bln
+7.122 bln
9.31%
jan 1, 2014
89.226 bln
+5.575 bln
6.66%
jan 1, 2015
92.491 bln
+3.265 bln
3.66%
jan 1, 2016
98.966 bln
+6.475 bln
7.0%
Ranking of countries by current statistics by years


Comments: