29
/
en
AIzaSyAYiBZKx7MnpbEhh9jyipgxe19OcubqV5w
April 1, 2024
209265
New Zealand
NZL
true
2
1
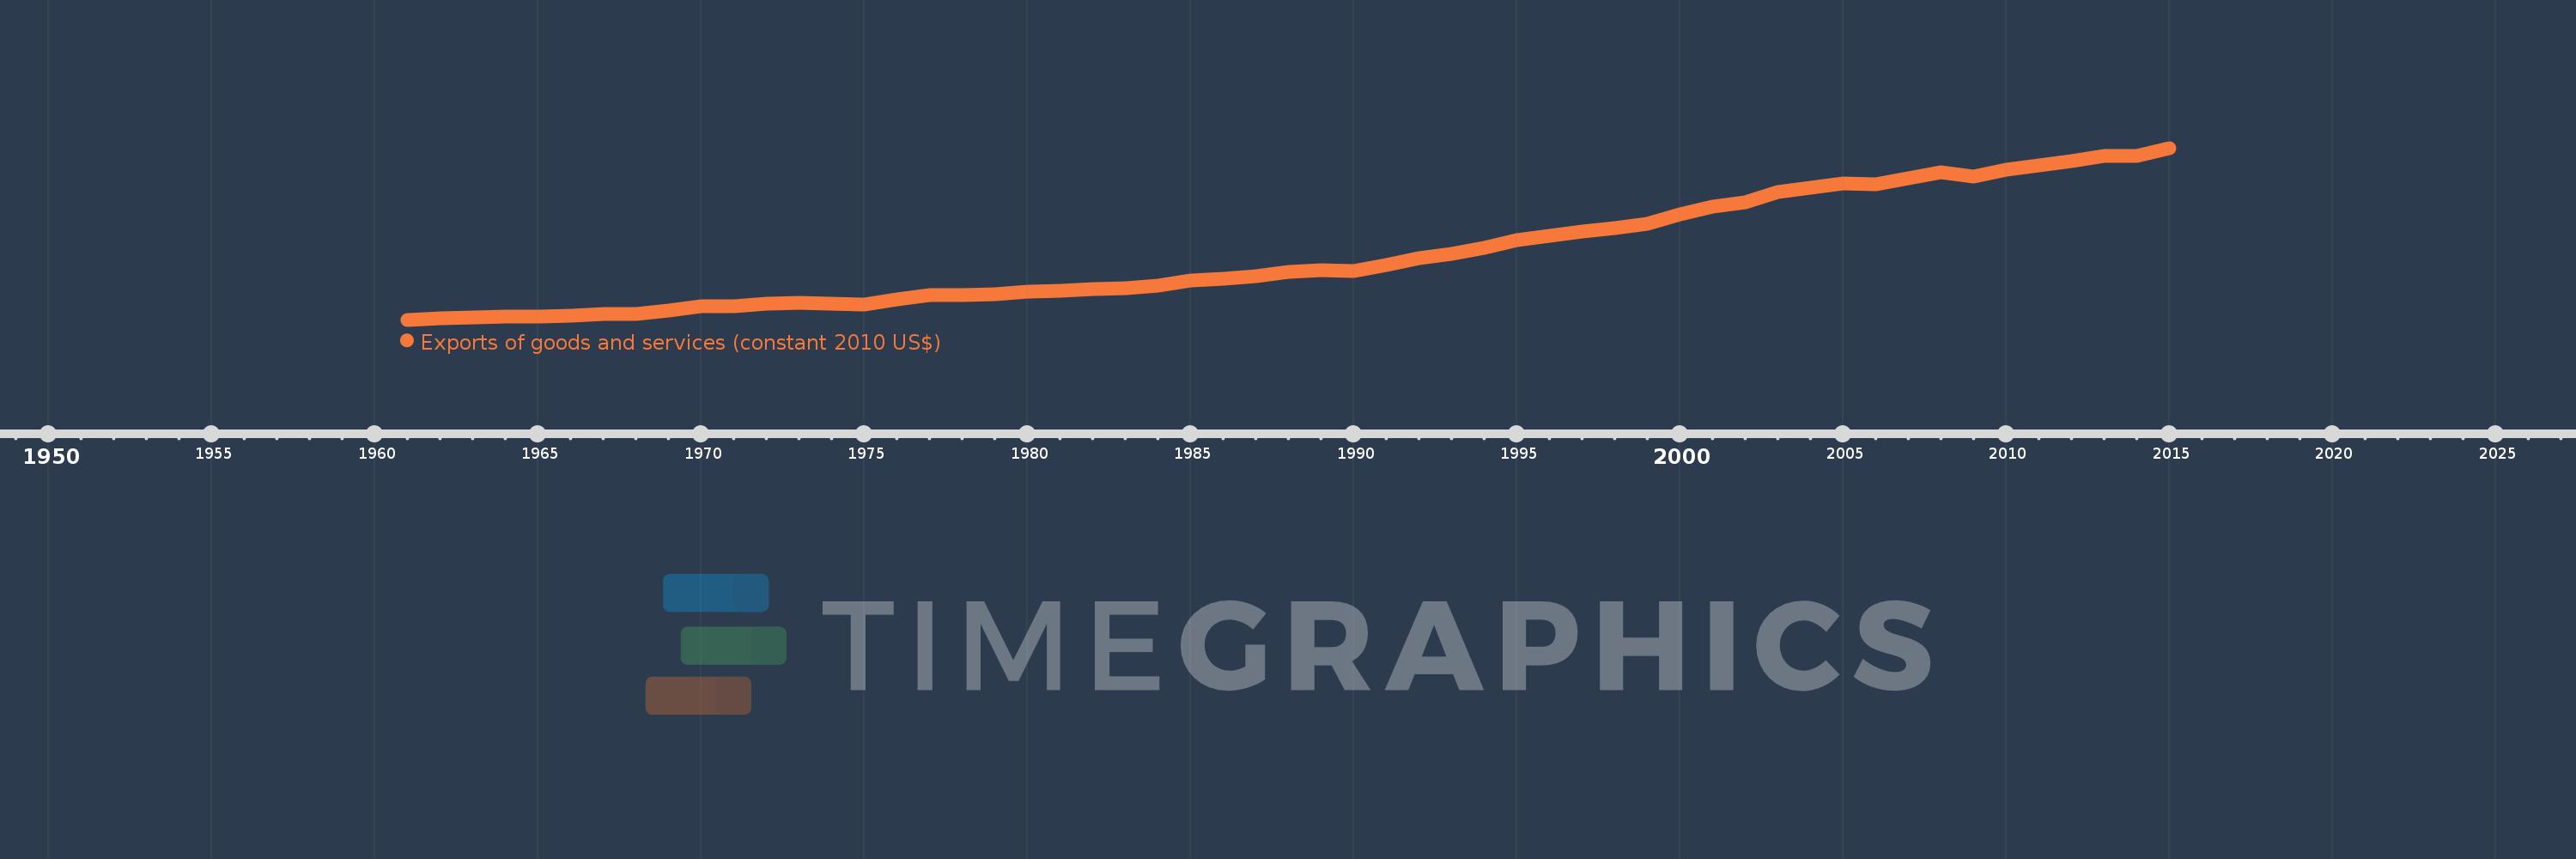
Exports of goods and services (constant 2010 US$)
2015,2014,2013,2012,2011,2010,2009,2008,2007,2006,2005,2004,2003,2002,2001,2000,1999,1998,1997,1996,1995,1994,1993,1992,1991,1990,1989,1988,1987,1986,1985,1984,1983,1982,1981,1980,1979,1978,1977,1976,1975,1974,1973,1972,1971,1970,1969,1968,1967,1966,1965,1964,1963,1962,1961
This statistics in other country:
AfghanistanAlbaniaAlgeriaAngolaAntigua and BarbudaArab WorldArgentinaArmeniaArubaAustraliaAustriaAzerbaijanBahamas, TheBahrainBangladeshBarbadosBelarusBelgiumBelizeBeninBermudaBhutanBoliviaBosnia and HerzegovinaBotswanaBrazilBrunei DarussalamBulgariaBurkina FasoBurundiCabo VerdeCambodiaCameroonCanadaCaribbean small statesCentral African RepublicCentral Europe and the BalticsChadChileChinaColombiaComorosCongo, Dem. Rep.Congo, Rep.Costa RicaCote d'IvoireCroatiaCubaCyprusCzech RepublicDenmarkDominicaDominican RepublicEarly-demographic dividendEast Asia & PacificEast Asia & Pacific (excluding high income)East Asia & Pacific (IDA & IBRD countries)EcuadorEgypt, Arab Rep.El SalvadorEquatorial GuineaEritreaEstoniaEuro areaEurope & Central AsiaEurope & Central Asia (excluding high income)Europe & Central Asia (IDA & IBRD countries)European UnionFaroe IslandsFijiFinlandFragile and conflict affected situationsFranceGabonGambia, TheGeorgiaGermanyGhanaGreeceGrenadaGuatemalaGuineaGuinea-BissauGuyanaHaitiHeavily indebted poor countries (HIPC)High incomeHondurasHong Kong SAR, ChinaHungaryIBRD onlyIcelandIDA & IBRD totalIDA blendIDA onlyIDA totalIndiaIndonesiaIran, Islamic Rep.IraqIrelandIsraelItalyJamaicaJapanJordanKazakhstanKenyaKiribatiKorea, Rep.KosovoKuwaitKyrgyz RepublicLao PDRLate-demographic dividendLatin America & Caribbean Latin America & Caribbean (excluding high income)Latin America & the Caribbean (IDA & IBRD countries)LatviaLeast developed countries: UN classificationLebanonLiberiaLibyaLithuaniaLow & middle incomeLow incomeLower middle incomeLuxembourgMacao SAR, ChinaMacedonia, FYRMadagascarMalawiMalaysiaMaldivesMaliMaltaMauritaniaMauritiusMexicoMiddle East & North AfricaMiddle East & North Africa (excluding high income)Middle East & North Africa (IDA & IBRD countries)Middle incomeMoldovaMongoliaMontenegroMoroccoMozambiqueMyanmarNamibiaNepalNetherlandsNew ZealandNicaraguaNigerNigeriaNorth AmericaNorwayOECD membersOmanOther small statesPacific island small statesPakistanPalauPanamaParaguayPeruPhilippinesPolandPortugalPost-demographic dividendPre-demographic dividendPuerto RicoQatarRomaniaRussian FederationRwandaSamoaSaudi ArabiaSenegalSerbiaSeychellesSierra LeoneSingaporeSlovak RepublicSloveniaSmall statesSolomon IslandsSouth AfricaSouth AsiaSouth Asia (IDA & IBRD)South SudanSpainSri LankaSt. Kitts and NevisSt. LuciaSt. Vincent and the GrenadinesSub-Saharan Africa Sub-Saharan Africa (excluding high income)Sub-Saharan Africa (IDA & IBRD countries)SudanSurinameSwazilandSwedenSwitzerlandTajikistanTanzaniaThailandTimor-LesteTogoTongaTrinidad and TobagoTunisiaTurkeyTurkmenistanUgandaUkraineUnited Arab EmiratesUnited KingdomUnited StatesUpper middle incomeUruguayUzbekistanVanuatuVenezuela, RBVietnamWest Bank and GazaWorldYemen, Rep.ZambiaZimbabwe Timeline:
This timeline shows a graph from 1961 to 2015 of New Zealand. No data until 1960. Number of actual observations by date: 55.
Source name:
World Development Indicators
Source organization:
World Bank national accounts data, and OECD National Accounts data files.
Categories, topics:
Economy & Growth, Trade
Last updated:
apr 23, 2017
Indicators value changes by year
Minimum:
5.352 bln
jan 1, 1961
Maximum:
48.728 bln
jan 1, 2015
At the date of observation
Value
Absolute change
Change from previous value
jan 1, 1961
5.352 bln
+5.352 bln
0.0%
jan 1, 1962
5.709 bln
+357.477 mln
6.68%
jan 1, 1963
5.901 bln
+192.429 mln
3.37%
jan 1, 1964
6.239 bln
+337.702 mln
5.72%
jan 1, 1965
6.181 bln
-57.805 mln
-0.93%
jan 1, 1966
6.32 bln
+139.188 mln
2.25%
jan 1, 1967
6.846 bln
+525.033 mln
8.31%
jan 1, 1968
6.782 bln
-63.804 mln
-0.93%
jan 1, 1969
7.694 bln
+912.436 mln
13.45%
jan 1, 1970
8.709 bln
+1.015 bln
13.19%
jan 1, 1971
8.834 bln
+125.452 mln
1.44%
jan 1, 1972
9.479 bln
+644.666 mln
7.3%
jan 1, 1973
9.675 bln
+195.801 mln
2.07%
jan 1, 1974
9.486 bln
-188.412 mln
-1.95%
jan 1, 1975
9.229 bln
-257.682 mln
-2.72%
jan 1, 1976
10.406 bln
+1.178 bln
12.76%
jan 1, 1977
11.56 bln
+1.154 bln
11.09%
jan 1, 1978
11.554 bln
-5.542 mln
-0.05%
jan 1, 1979
11.832 bln
+278.001 mln
2.41%
jan 1, 1980
12.353 bln
+520.905 mln
4.4%
jan 1, 1981
12.745 bln
+391.602 mln
3.17%
jan 1, 1982
13.038 bln
+293.702 mln
2.3%
jan 1, 1983
13.242 bln
+203.19 mln
1.56%
jan 1, 1984
14.048 bln
+806.294 mln
6.09%
jan 1, 1985
15.365 bln
+1.317 bln
9.38%
jan 1, 1986
15.62 bln
+254.911 mln
1.66%
jan 1, 1987
16.337 bln
+717.629 mln
4.59%
jan 1, 1988
17.531 bln
+1.194 bln
7.31%
jan 1, 1989
17.905 bln
+373.205 mln
2.13%
jan 1, 1990
17.55 bln
-354.66 mln
-1.98%
jan 1, 1991
19.185 bln
+1.635 bln
9.32%
jan 1, 1992
20.958 bln
+1.773 bln
9.24%
jan 1, 1993
21.92 bln
+961.987 mln
4.59%
jan 1, 1994
23.487 bln
+1.567 bln
7.15%
jan 1, 1995
25.483 bln
+1.996 bln
8.5%
jan 1, 1996
26.445 bln
+961.987 mln
3.78%
jan 1, 1997
27.555 bln
+1.11 bln
4.2%
jan 1, 1998
28.496 bln
+940.352 mln
3.41%
jan 1, 1999
29.469 bln
+973.577 mln
3.42%
jan 1, 2000
31.916 bln
+2.446 bln
8.3%
jan 1, 2001
33.846 bln
+1.931 bln
6.05%
jan 1, 2002
34.96 bln
+1.113 bln
3.29%
jan 1, 2003
37.596 bln
+2.636 bln
7.54%
jan 1, 2004
38.606 bln
+1.01 bln
2.69%
jan 1, 2005
39.826 bln
+1.22 bln
3.16%
jan 1, 2006
39.648 bln
-178.489 mln
-0.45%
jan 1, 2007
41.028 bln
+1.38 bln
3.48%
jan 1, 2008
42.623 bln
+1.595 bln
3.89%
jan 1, 2009
41.462 bln
-1.161 bln
-2.72%
jan 1, 2010
43.14 bln
+1.678 bln
4.05%
jan 1, 2011
44.357 bln
+1.217 bln
2.82%
jan 1, 2012
45.373 bln
+1.015 bln
2.29%
jan 1, 2013
46.751 bln
+1.378 bln
3.04%
jan 1, 2014
46.76 bln
+8.499 mln
0.02%
jan 1, 2015
48.728 bln
+1.969 bln
4.21%
Ranking of countries by current statistics by years


Comments: