29
/
en
AIzaSyAYiBZKx7MnpbEhh9jyipgxe19OcubqV5w
April 1, 2024
58879
Sub-Saharan Africa
SSF
false
2
1
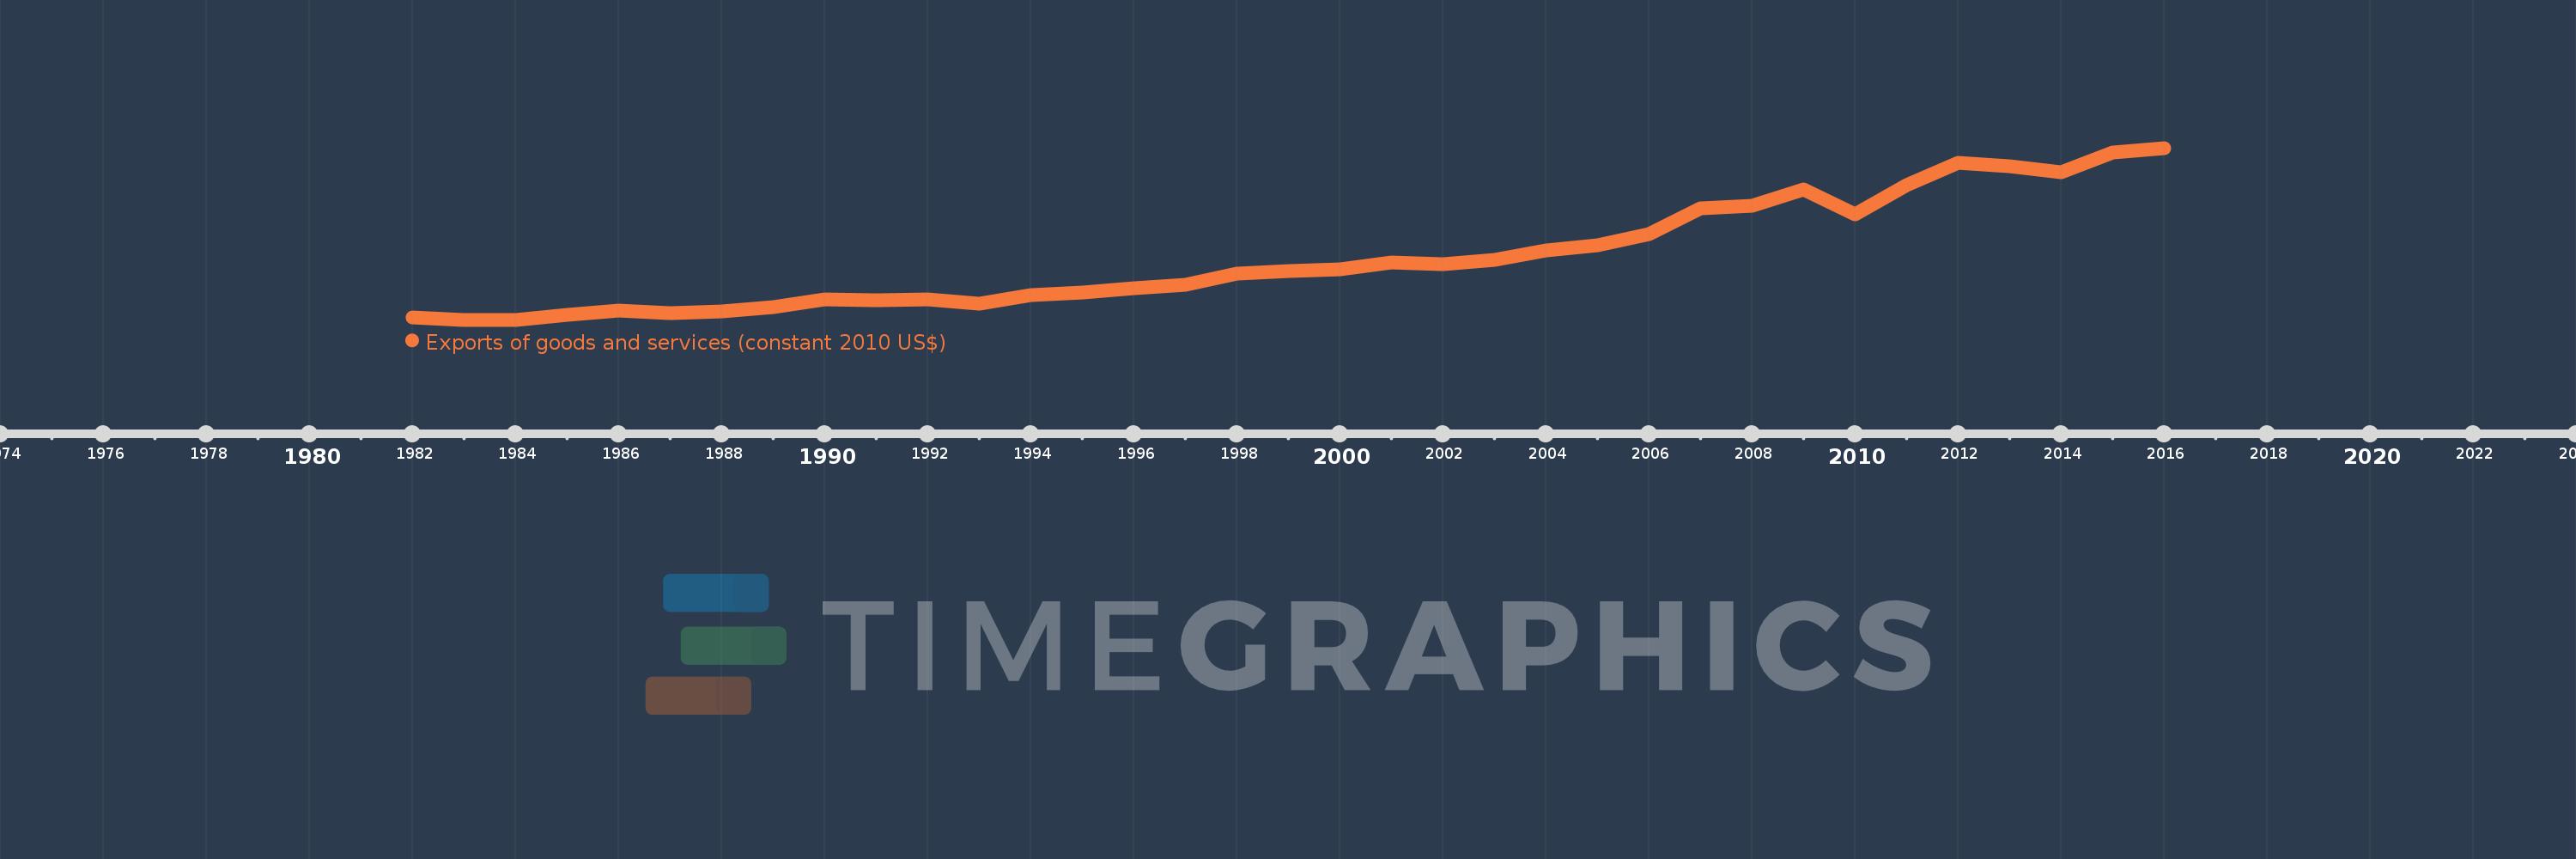
Exports of goods and services (constant 2010 US$)
2016,2015,2014,2013,2012,2011,2010,2009,2008,2007,2006,2005,2004,2003,2002,2001,2000,1999,1998,1997,1996,1995,1994,1993,1992,1991,1990,1989,1988,1987,1986,1985,1984,1983,1982
This statistics in other country:
AfghanistanAlbaniaAlgeriaAngolaAntigua and BarbudaArab WorldArgentinaArmeniaArubaAustraliaAustriaAzerbaijanBahamas, TheBahrainBangladeshBarbadosBelarusBelgiumBelizeBeninBermudaBhutanBoliviaBosnia and HerzegovinaBotswanaBrazilBrunei DarussalamBulgariaBurkina FasoBurundiCabo VerdeCambodiaCameroonCanadaCaribbean small statesCentral African RepublicCentral Europe and the BalticsChadChileChinaColombiaComorosCongo, Dem. Rep.Congo, Rep.Costa RicaCote d'IvoireCroatiaCubaCyprusCzech RepublicDenmarkDominicaDominican RepublicEarly-demographic dividendEast Asia & PacificEast Asia & Pacific (excluding high income)East Asia & Pacific (IDA & IBRD countries)EcuadorEgypt, Arab Rep.El SalvadorEquatorial GuineaEritreaEstoniaEuro areaEurope & Central AsiaEurope & Central Asia (excluding high income)Europe & Central Asia (IDA & IBRD countries)European UnionFaroe IslandsFijiFinlandFragile and conflict affected situationsFranceGabonGambia, TheGeorgiaGermanyGhanaGreeceGrenadaGuatemalaGuineaGuinea-BissauGuyanaHaitiHeavily indebted poor countries (HIPC)High incomeHondurasHong Kong SAR, ChinaHungaryIBRD onlyIcelandIDA & IBRD totalIDA blendIDA onlyIDA totalIndiaIndonesiaIran, Islamic Rep.IraqIrelandIsraelItalyJamaicaJapanJordanKazakhstanKenyaKiribatiKorea, Rep.KosovoKuwaitKyrgyz RepublicLao PDRLate-demographic dividendLatin America & Caribbean Latin America & Caribbean (excluding high income)Latin America & the Caribbean (IDA & IBRD countries)LatviaLeast developed countries: UN classificationLebanonLiberiaLibyaLithuaniaLow & middle incomeLow incomeLower middle incomeLuxembourgMacao SAR, ChinaMacedonia, FYRMadagascarMalawiMalaysiaMaldivesMaliMaltaMauritaniaMauritiusMexicoMiddle East & North AfricaMiddle East & North Africa (excluding high income)Middle East & North Africa (IDA & IBRD countries)Middle incomeMoldovaMongoliaMontenegroMoroccoMozambiqueMyanmarNamibiaNepalNetherlandsNew ZealandNicaraguaNigerNigeriaNorth AmericaNorwayOECD membersOmanOther small statesPacific island small statesPakistanPalauPanamaParaguayPeruPhilippinesPolandPortugalPost-demographic dividendPre-demographic dividendPuerto RicoQatarRomaniaRussian FederationRwandaSamoaSaudi ArabiaSenegalSerbiaSeychellesSierra LeoneSingaporeSlovak RepublicSloveniaSmall statesSolomon IslandsSouth AfricaSouth AsiaSouth Asia (IDA & IBRD)South SudanSpainSri LankaSt. Kitts and NevisSt. LuciaSt. Vincent and the GrenadinesSub-Saharan Africa Sub-Saharan Africa (excluding high income)Sub-Saharan Africa (IDA & IBRD countries)SudanSurinameSwazilandSwedenSwitzerlandTajikistanTanzaniaThailandTimor-LesteTogoTongaTrinidad and TobagoTunisiaTurkeyTurkmenistanUgandaUkraineUnited Arab EmiratesUnited KingdomUnited StatesUpper middle incomeUruguayUzbekistanVanuatuVenezuela, RBVietnamWest Bank and GazaWorldYemen, Rep.ZambiaZimbabwe Timeline:
This timeline shows a graph from 1982 to 2016 of Sub-Saharan Africa . No data until 1981. Number of actual observations by date: 35.
Source name:
World Development Indicators
Source organization:
World Bank national accounts data, and OECD National Accounts data files.
Categories, topics:
Economy & Growth, Trade
Last updated:
apr 23, 2017
Indicators value changes by year
Minimum:
129.463 bln
jan 1, 1983
Maximum:
503.804 bln
jan 1, 2016
At the date of observation
Value
Absolute change
Change from previous value
jan 1, 1982
135.148 bln
+135.148 bln
0.0%
jan 1, 1983
129.463 bln
-5.686 bln
-4.21%
jan 1, 1984
129.651 bln
+188.586 mln
0.15%
jan 1, 1985
139.438 bln
+9.787 bln
7.55%
jan 1, 1986
148.745 bln
+9.307 bln
6.67%
jan 1, 1987
143.929 bln
-4.816 bln
-3.24%
jan 1, 1988
148.499 bln
+4.57 bln
3.18%
jan 1, 1989
156.934 bln
+8.435 bln
5.68%
jan 1, 1990
173.322 bln
+16.388 bln
10.44%
jan 1, 1991
172.274 bln
-1.048 bln
-0.6%
jan 1, 1992
174.667 bln
+2.393 bln
1.39%
jan 1, 1993
164.707 bln
-9.96 bln
-5.7%
jan 1, 1994
183.053 bln
+18.346 bln
11.14%
jan 1, 1995
189.337 bln
+6.284 bln
3.43%
jan 1, 1996
199.065 bln
+9.728 bln
5.14%
jan 1, 1997
205.158 bln
+6.093 bln
3.06%
jan 1, 1998
230.524 bln
+25.365 bln
12.36%
jan 1, 1999
236.174 bln
+5.651 bln
2.45%
jan 1, 2000
240.216 bln
+4.042 bln
1.71%
jan 1, 2001
254.149 bln
+13.933 bln
5.8%
jan 1, 2002
249.634 bln
-4.515 bln
-1.78%
jan 1, 2003
260.42 bln
+10.787 bln
4.32%
jan 1, 2004
279.879 bln
+19.458 bln
7.47%
jan 1, 2005
291.402 bln
+11.524 bln
4.12%
jan 1, 2006
315.401 bln
+23.998 bln
8.24%
jan 1, 2007
372.31 bln
+56.909 bln
18.04%
jan 1, 2008
378.383 bln
+6.073 bln
1.63%
jan 1, 2009
413.607 bln
+35.223 bln
9.31%
jan 1, 2010
359.176 bln
-54.43 bln
-13.16%
jan 1, 2011
422.952 bln
+63.775 bln
17.76%
jan 1, 2012
471.326 bln
+48.374 bln
11.44%
jan 1, 2013
464.574 bln
-6.752 bln
-1.43%
jan 1, 2014
450.815 bln
-13.759 bln
-2.96%
jan 1, 2015
493.935 bln
+43.12 bln
9.56%
jan 1, 2016
503.804 bln
+9.869 bln
2.0%
Ranking of countries by current statistics by years


Comments: