29
/
en
AIzaSyAYiBZKx7MnpbEhh9jyipgxe19OcubqV5w
April 1, 2024
52566
OECD members
OED
false
2
1
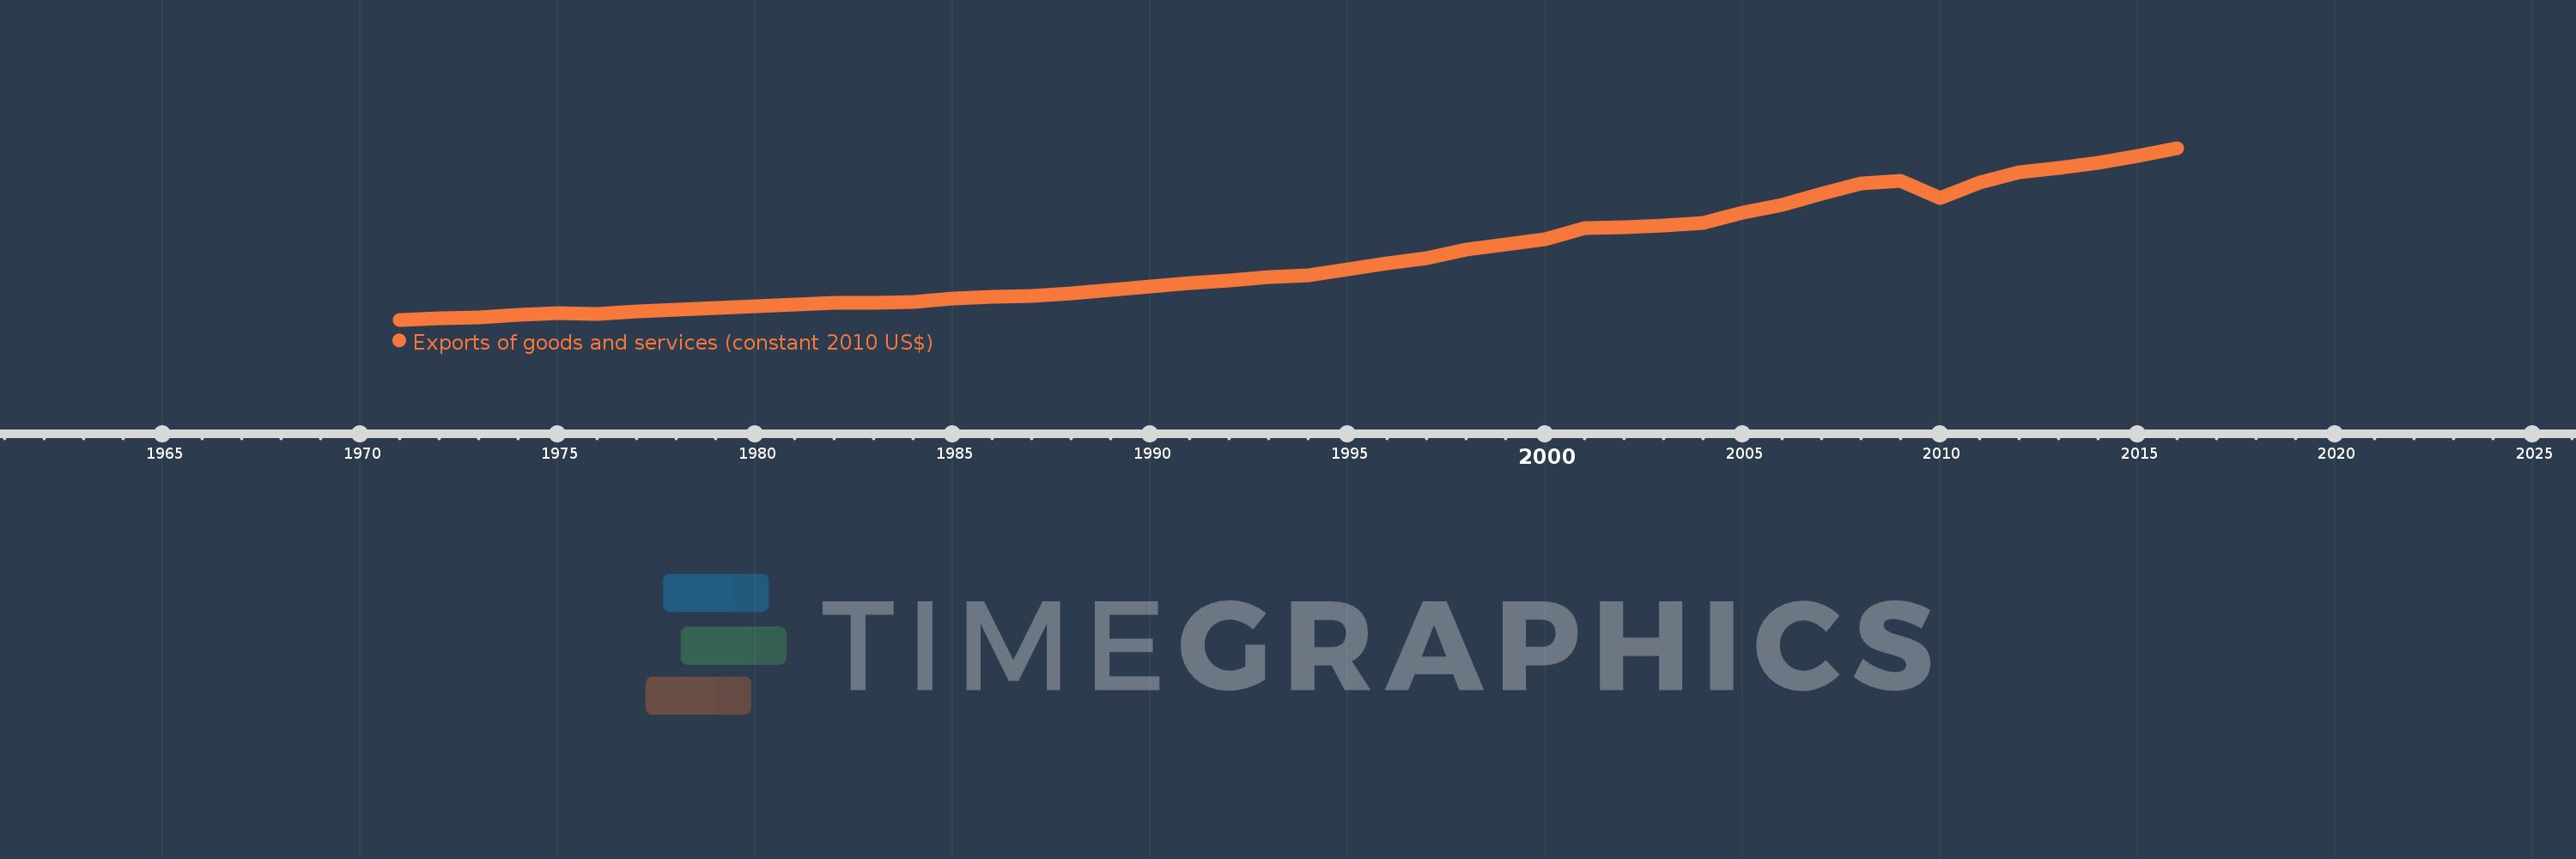
Exports of goods and services (constant 2010 US$)
2016,2015,2014,2013,2012,2011,2010,2009,2008,2007,2006,2005,2004,2003,2002,2001,2000,1999,1998,1997,1996,1995,1994,1993,1992,1991,1990,1989,1988,1987,1986,1985,1984,1983,1982,1981,1980,1979,1978,1977,1976,1975,1974,1973,1972,1971
This statistics in other country:
AfghanistanAlbaniaAlgeriaAngolaAntigua and BarbudaArab WorldArgentinaArmeniaArubaAustraliaAustriaAzerbaijanBahamas, TheBahrainBangladeshBarbadosBelarusBelgiumBelizeBeninBermudaBhutanBoliviaBosnia and HerzegovinaBotswanaBrazilBrunei DarussalamBulgariaBurkina FasoBurundiCabo VerdeCambodiaCameroonCanadaCaribbean small statesCentral African RepublicCentral Europe and the BalticsChadChileChinaColombiaComorosCongo, Dem. Rep.Congo, Rep.Costa RicaCote d'IvoireCroatiaCubaCyprusCzech RepublicDenmarkDominicaDominican RepublicEarly-demographic dividendEast Asia & PacificEast Asia & Pacific (excluding high income)East Asia & Pacific (IDA & IBRD countries)EcuadorEgypt, Arab Rep.El SalvadorEquatorial GuineaEritreaEstoniaEuro areaEurope & Central AsiaEurope & Central Asia (excluding high income)Europe & Central Asia (IDA & IBRD countries)European UnionFaroe IslandsFijiFinlandFragile and conflict affected situationsFranceGabonGambia, TheGeorgiaGermanyGhanaGreeceGrenadaGuatemalaGuineaGuinea-BissauGuyanaHaitiHeavily indebted poor countries (HIPC)High incomeHondurasHong Kong SAR, ChinaHungaryIBRD onlyIcelandIDA & IBRD totalIDA blendIDA onlyIDA totalIndiaIndonesiaIran, Islamic Rep.IraqIrelandIsraelItalyJamaicaJapanJordanKazakhstanKenyaKiribatiKorea, Rep.KosovoKuwaitKyrgyz RepublicLao PDRLate-demographic dividendLatin America & Caribbean Latin America & Caribbean (excluding high income)Latin America & the Caribbean (IDA & IBRD countries)LatviaLeast developed countries: UN classificationLebanonLiberiaLibyaLithuaniaLow & middle incomeLow incomeLower middle incomeLuxembourgMacao SAR, ChinaMacedonia, FYRMadagascarMalawiMalaysiaMaldivesMaliMaltaMauritaniaMauritiusMexicoMiddle East & North AfricaMiddle East & North Africa (excluding high income)Middle East & North Africa (IDA & IBRD countries)Middle incomeMoldovaMongoliaMontenegroMoroccoMozambiqueMyanmarNamibiaNepalNetherlandsNew ZealandNicaraguaNigerNigeriaNorth AmericaNorwayOECD membersOmanOther small statesPacific island small statesPakistanPalauPanamaParaguayPeruPhilippinesPolandPortugalPost-demographic dividendPre-demographic dividendPuerto RicoQatarRomaniaRussian FederationRwandaSamoaSaudi ArabiaSenegalSerbiaSeychellesSierra LeoneSingaporeSlovak RepublicSloveniaSmall statesSolomon IslandsSouth AfricaSouth AsiaSouth Asia (IDA & IBRD)South SudanSpainSri LankaSt. Kitts and NevisSt. LuciaSt. Vincent and the GrenadinesSub-Saharan Africa Sub-Saharan Africa (excluding high income)Sub-Saharan Africa (IDA & IBRD countries)SudanSurinameSwazilandSwedenSwitzerlandTajikistanTanzaniaThailandTimor-LesteTogoTongaTrinidad and TobagoTunisiaTurkeyTurkmenistanUgandaUkraineUnited Arab EmiratesUnited KingdomUnited StatesUpper middle incomeUruguayUzbekistanVanuatuVenezuela, RBVietnamWest Bank and GazaWorldYemen, Rep.ZambiaZimbabwe Timeline:
This timeline shows a graph from 1971 to 2016 of OECD members. No data until 1970. Number of actual observations by date: 46.
Source name:
World Development Indicators
Source organization:
World Bank national accounts data, and OECD National Accounts data files.
Categories, topics:
Economy & Growth, Trade
Last updated:
apr 23, 2017
Indicators value changes by year
Minimum:
1.414 trl
jan 1, 1971
Maximum:
14.063 trl
jan 1, 2016
At the date of observation
Value
Absolute change
Change from previous value
jan 1, 1971
1.414 trl
+1.414 trl
0.0%
jan 1, 1972
1.5 trl
+86.397 bln
6.11%
jan 1, 1973
1.615 trl
+114.771 bln
7.65%
jan 1, 1974
1.794 trl
+178.986 bln
11.08%
jan 1, 1975
1.911 trl
+117.234 bln
6.53%
jan 1, 1976
1.855 trl
-55.83 bln
-2.92%
jan 1, 1977
2.026 trl
+170.467 bln
9.19%
jan 1, 1978
2.147 trl
+120.892 bln
5.97%
jan 1, 1979
2.277 trl
+130.317 bln
6.07%
jan 1, 1980
2.429 trl
+151.489 bln
6.65%
jan 1, 1981
2.544 trl
+115.663 bln
4.76%
jan 1, 1982
2.663 trl
+119.095 bln
4.68%
jan 1, 1983
2.663 trl
-859.646 mln
-0.03%
jan 1, 1984
2.739 trl
+76.655 bln
2.88%
jan 1, 1985
2.992 trl
+252.461 bln
9.22%
jan 1, 1986
3.13 trl
+138.684 bln
4.64%
jan 1, 1987
3.196 trl
+65.86 bln
2.1%
jan 1, 1988
3.346 trl
+150.259 bln
4.7%
jan 1, 1989
3.609 trl
+262.897 bln
7.86%
jan 1, 1990
3.885 trl
+275.285 bln
7.63%
jan 1, 1991
4.141 trl
+256.404 bln
6.6%
jan 1, 1992
4.335 trl
+193.958 bln
4.68%
jan 1, 1993
4.548 trl
+212.698 bln
4.91%
jan 1, 1994
4.708 trl
+160.406 bln
3.53%
jan 1, 1995
5.13 trl
+421.814 bln
8.96%
jan 1, 1996
5.584 trl
+454.157 bln
8.85%
jan 1, 1997
5.956 trl
+372.056 bln
6.66%
jan 1, 1998
6.612 trl
+655.454 bln
11.0%
jan 1, 1999
6.965 trl
+353.031 bln
5.34%
jan 1, 2000
7.31 trl
+345.188 bln
4.96%
jan 1, 2001
8.168 trl
+858.522 bln
11.74%
jan 1, 2002
8.213 trl
+44.227 bln
0.54%
jan 1, 2003
8.375 trl
+162.107 bln
1.97%
jan 1, 2004
8.568 trl
+192.975 bln
2.3%
jan 1, 2005
9.329 trl
+761.682 bln
8.89%
jan 1, 2006
9.863 trl
+533.539 bln
5.72%
jan 1, 2007
10.701 trl
+838.494 bln
8.5%
jan 1, 2008
11.436 trl
+734.213 bln
6.86%
jan 1, 2009
11.662 trl
+226.892 bln
1.98%
jan 1, 2010
10.354 trl
-1.309 trl
-11.22%
jan 1, 2011
11.545 trl
+1.191 trl
11.51%
jan 1, 2012
12.263 trl
+717.68 bln
6.22%
jan 1, 2013
12.594 trl
+331.375 bln
2.7%
jan 1, 2014
12.941 trl
+347.223 bln
2.76%
jan 1, 2015
13.49 trl
+548.514 bln
4.24%
jan 1, 2016
14.063 trl
+573.762 bln
4.25%
Ranking of countries by current statistics by years


Comments: