29
/
en
AIzaSyAYiBZKx7MnpbEhh9jyipgxe19OcubqV5w
April 1, 2024
144299
Guatemala
GTM
true
2
1
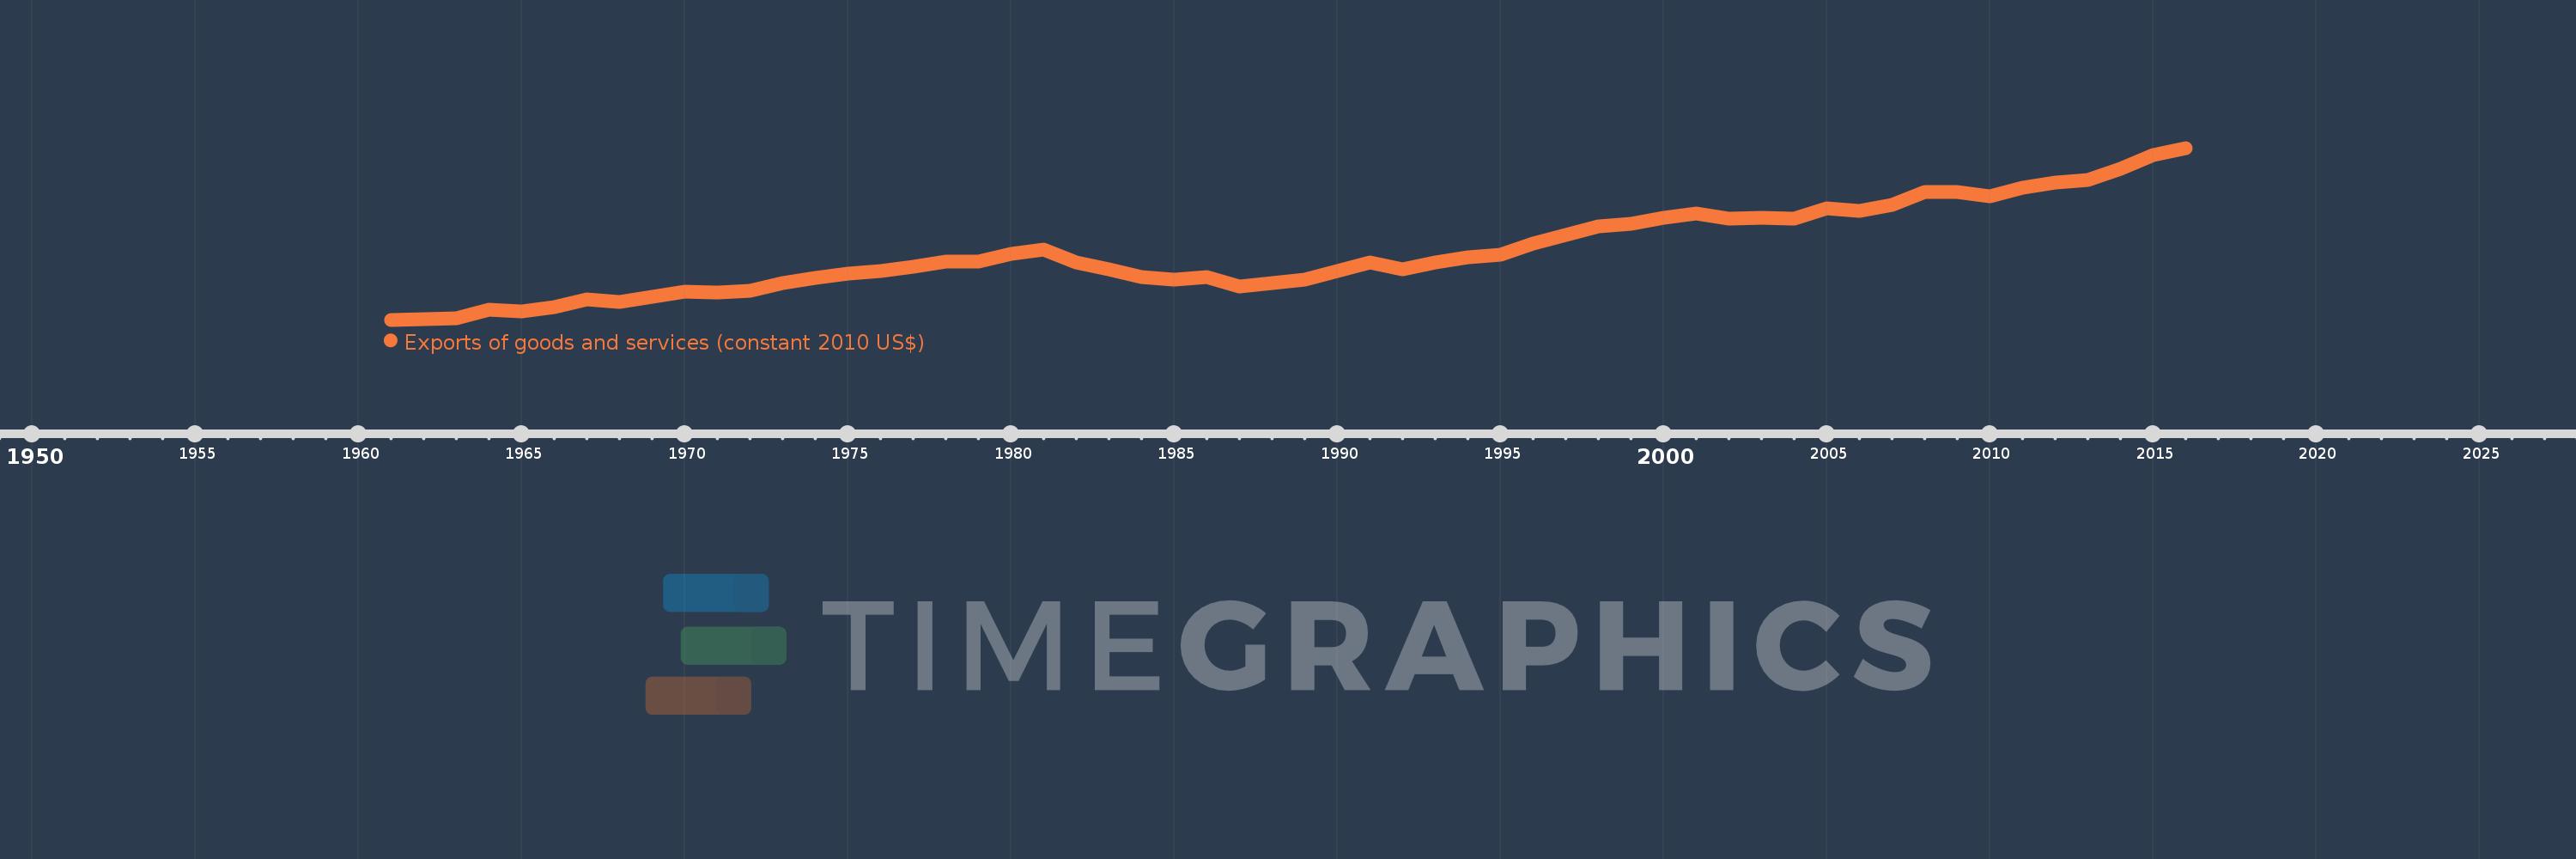
Exports of goods and services (constant 2010 US$)
2016,2015,2014,2013,2012,2011,2010,2009,2008,2007,2006,2005,2004,2003,2002,2001,2000,1999,1998,1997,1996,1995,1994,1993,1992,1991,1990,1989,1988,1987,1986,1985,1984,1983,1982,1981,1980,1979,1978,1977,1976,1975,1974,1973,1972,1971,1970,1969,1968,1967,1966,1965,1964,1963,1962,1961
This statistics in other country:
AfghanistanAlbaniaAlgeriaAngolaAntigua and BarbudaArab WorldArgentinaArmeniaArubaAustraliaAustriaAzerbaijanBahamas, TheBahrainBangladeshBarbadosBelarusBelgiumBelizeBeninBermudaBhutanBoliviaBosnia and HerzegovinaBotswanaBrazilBrunei DarussalamBulgariaBurkina FasoBurundiCabo VerdeCambodiaCameroonCanadaCaribbean small statesCentral African RepublicCentral Europe and the BalticsChadChileChinaColombiaComorosCongo, Dem. Rep.Congo, Rep.Costa RicaCote d'IvoireCroatiaCubaCyprusCzech RepublicDenmarkDominicaDominican RepublicEarly-demographic dividendEast Asia & PacificEast Asia & Pacific (excluding high income)East Asia & Pacific (IDA & IBRD countries)EcuadorEgypt, Arab Rep.El SalvadorEquatorial GuineaEritreaEstoniaEuro areaEurope & Central AsiaEurope & Central Asia (excluding high income)Europe & Central Asia (IDA & IBRD countries)European UnionFaroe IslandsFijiFinlandFragile and conflict affected situationsFranceGabonGambia, TheGeorgiaGermanyGhanaGreeceGrenadaGuatemalaGuineaGuinea-BissauGuyanaHaitiHeavily indebted poor countries (HIPC)High incomeHondurasHong Kong SAR, ChinaHungaryIBRD onlyIcelandIDA & IBRD totalIDA blendIDA onlyIDA totalIndiaIndonesiaIran, Islamic Rep.IraqIrelandIsraelItalyJamaicaJapanJordanKazakhstanKenyaKiribatiKorea, Rep.KosovoKuwaitKyrgyz RepublicLao PDRLate-demographic dividendLatin America & Caribbean Latin America & Caribbean (excluding high income)Latin America & the Caribbean (IDA & IBRD countries)LatviaLeast developed countries: UN classificationLebanonLiberiaLibyaLithuaniaLow & middle incomeLow incomeLower middle incomeLuxembourgMacao SAR, ChinaMacedonia, FYRMadagascarMalawiMalaysiaMaldivesMaliMaltaMauritaniaMauritiusMexicoMiddle East & North AfricaMiddle East & North Africa (excluding high income)Middle East & North Africa (IDA & IBRD countries)Middle incomeMoldovaMongoliaMontenegroMoroccoMozambiqueMyanmarNamibiaNepalNetherlandsNew ZealandNicaraguaNigerNigeriaNorth AmericaNorwayOECD membersOmanOther small statesPacific island small statesPakistanPalauPanamaParaguayPeruPhilippinesPolandPortugalPost-demographic dividendPre-demographic dividendPuerto RicoQatarRomaniaRussian FederationRwandaSamoaSaudi ArabiaSenegalSerbiaSeychellesSierra LeoneSingaporeSlovak RepublicSloveniaSmall statesSolomon IslandsSouth AfricaSouth AsiaSouth Asia (IDA & IBRD)South SudanSpainSri LankaSt. Kitts and NevisSt. LuciaSt. Vincent and the GrenadinesSub-Saharan Africa Sub-Saharan Africa (excluding high income)Sub-Saharan Africa (IDA & IBRD countries)SudanSurinameSwazilandSwedenSwitzerlandTajikistanTanzaniaThailandTimor-LesteTogoTongaTrinidad and TobagoTunisiaTurkeyTurkmenistanUgandaUkraineUnited Arab EmiratesUnited KingdomUnited StatesUpper middle incomeUruguayUzbekistanVanuatuVenezuela, RBVietnamWest Bank and GazaWorldYemen, Rep.ZambiaZimbabwe Timeline:
This timeline shows a graph from 1961 to 2016 of Guatemala. No data until 1960. Number of actual observations by date: 56.
Source name:
World Development Indicators
Source organization:
World Bank national accounts data, and OECD National Accounts data files.
Categories, topics:
Economy & Growth, Trade
Last updated:
apr 23, 2017
Indicators value changes by year
Minimum:
1.494 bln
jan 1, 1961
Maximum:
13.392 bln
jan 1, 2016
At the date of observation
Value
Absolute change
Change from previous value
jan 1, 1961
1.494 bln
+1.494 bln
0.0%
jan 1, 1962
1.529 bln
+35.155 mln
2.35%
jan 1, 1963
1.588 bln
+58.591 mln
3.83%
jan 1, 1964
2.178 bln
+589.821 mln
37.15%
jan 1, 1965
2.094 bln
-83.981 mln
-3.86%
jan 1, 1966
2.368 bln
+273.837 mln
13.08%
jan 1, 1967
2.911 bln
+543.042 mln
22.94%
jan 1, 1968
2.724 bln
-186.549 mln
-6.41%
jan 1, 1969
3.064 bln
+339.889 mln
12.48%
jan 1, 1970
3.457 bln
+392.631 mln
12.81%
jan 1, 1971
3.379 bln
-77.159 mln
-2.23%
jan 1, 1972
3.52 bln
+140.644 mln
4.16%
jan 1, 1973
4.025 bln
+504.951 mln
14.35%
jan 1, 1974
4.411 bln
+385.794 mln
9.59%
jan 1, 1975
4.704 bln
+293.008 mln
6.64%
jan 1, 1976
4.859 bln
+155.294 mln
3.3%
jan 1, 1977
5.179 bln
+320.356 mln
6.59%
jan 1, 1978
5.502 bln
+322.309 mln
6.22%
jan 1, 1979
5.496 bln
-5.86 mln
-0.11%
jan 1, 1980
6.048 bln
+551.832 mln
10.04%
jan 1, 1981
6.359 bln
+311.566 mln
5.15%
jan 1, 1982
5.443 bln
-916.139 mln
-14.41%
jan 1, 1983
4.983 bln
-460.022 mln
-8.45%
jan 1, 1984
4.441 bln
-542.065 mln
-10.88%
jan 1, 1985
4.297 bln
-143.574 mln
-3.23%
jan 1, 1986
4.434 bln
+136.737 mln
3.18%
jan 1, 1987
3.814 bln
-620.201 mln
-13.99%
jan 1, 1988
4.044 bln
+229.523 mln
6.02%
jan 1, 1989
4.271 bln
+227.57 mln
5.63%
jan 1, 1990
4.839 bln
+567.459 mln
13.29%
jan 1, 1991
5.49 bln
+651.455 mln
13.46%
jan 1, 1992
4.991 bln
-499.091 mln
-9.09%
jan 1, 1993
5.46 bln
+468.813 mln
9.39%
jan 1, 1994
5.824 bln
+364.181 mln
6.67%
jan 1, 1995
6.02 bln
+195.768 mln
3.36%
jan 1, 1996
6.776 bln
+756.097 mln
12.56%
jan 1, 1997
7.364 bln
+588.553 mln
8.69%
jan 1, 1998
7.961 bln
+596.715 mln
8.1%
jan 1, 1999
8.152 bln
+190.612 mln
2.39%
jan 1, 2000
8.527 bln
+375.301 mln
4.6%
jan 1, 2001
8.852 bln
+325.469 mln
3.82%
jan 1, 2002
8.499 bln
-353.214 mln
-3.99%
jan 1, 2003
8.56 bln
+60.37 mln
0.71%
jan 1, 2004
8.515 bln
-44.302 mln
-0.52%
jan 1, 2005
9.215 bln
+699.697 mln
8.22%
jan 1, 2006
9.021 bln
-194.402 mln
-2.11%
jan 1, 2007
9.453 bln
+432.145 mln
4.79%
jan 1, 2008
10.343 bln
+890.078 mln
9.42%
jan 1, 2009
10.326 bln
-16.858 mln
-0.16%
jan 1, 2010
10.051 bln
-274.796 mln
-2.66%
jan 1, 2011
10.668 bln
+616.534 mln
6.13%
jan 1, 2012
10.989 bln
+320.879 mln
3.01%
jan 1, 2013
11.181 bln
+192.7 mln
1.75%
jan 1, 2014
11.926 bln
+744.977 mln
6.66%
jan 1, 2015
12.872 bln
+945.915 mln
7.93%
jan 1, 2016
13.392 bln
+520.313 mln
4.04%
Ranking of countries by current statistics by years


Comments: