29
/
en
AIzaSyAYiBZKx7MnpbEhh9jyipgxe19OcubqV5w
April 1, 2024
277611
Uruguay
URY
true
2
1
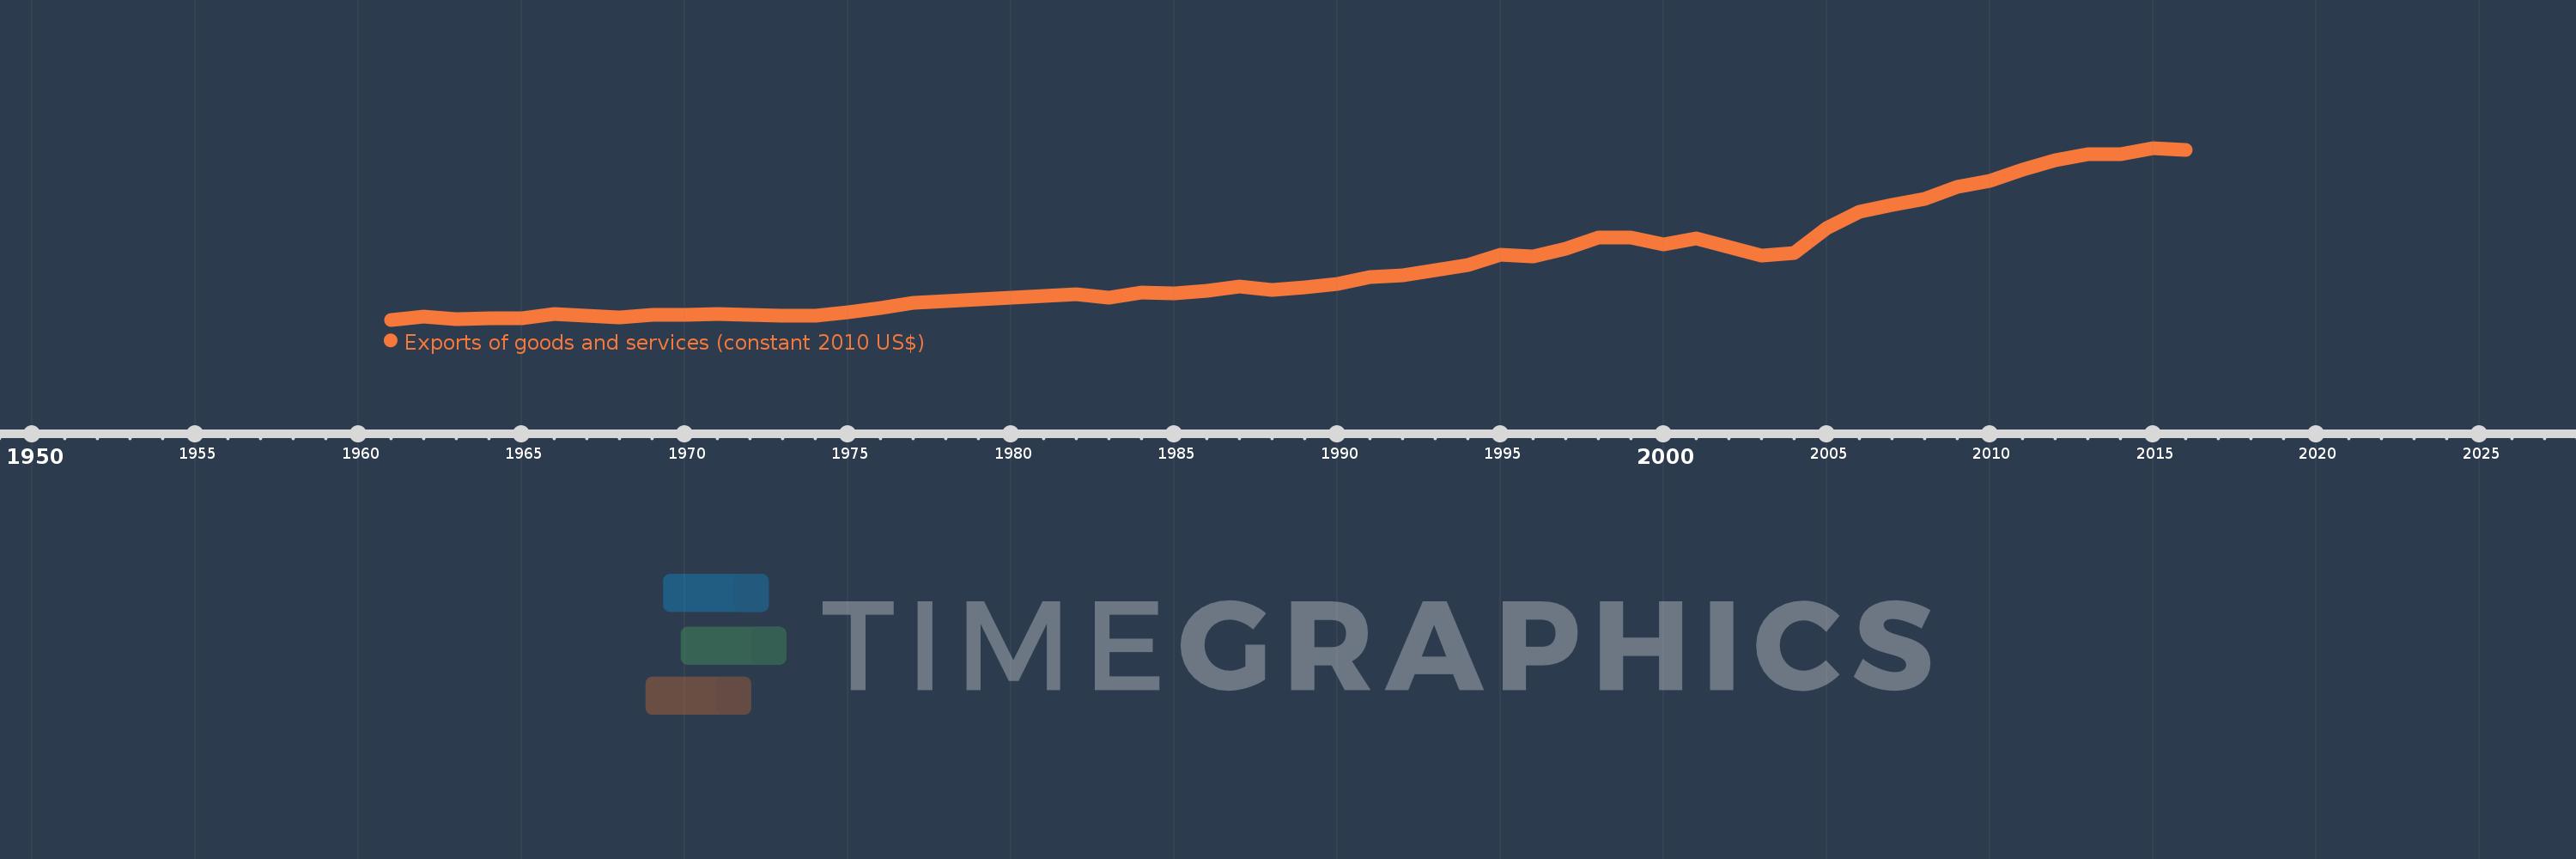
Exports of goods and services (constant 2010 US$)
2016,2015,2014,2013,2012,2011,2010,2009,2008,2007,2006,2005,2004,2003,2002,2001,2000,1999,1998,1997,1996,1995,1994,1993,1992,1991,1990,1989,1988,1987,1986,1985,1984,1983,1982,1981,1980,1979,1978,1977,1976,1975,1974,1973,1972,1971,1970,1969,1968,1967,1966,1965,1964,1963,1962,1961
This statistics in other country:
AfghanistanAlbaniaAlgeriaAngolaAntigua and BarbudaArab WorldArgentinaArmeniaArubaAustraliaAustriaAzerbaijanBahamas, TheBahrainBangladeshBarbadosBelarusBelgiumBelizeBeninBermudaBhutanBoliviaBosnia and HerzegovinaBotswanaBrazilBrunei DarussalamBulgariaBurkina FasoBurundiCabo VerdeCambodiaCameroonCanadaCaribbean small statesCentral African RepublicCentral Europe and the BalticsChadChileChinaColombiaComorosCongo, Dem. Rep.Congo, Rep.Costa RicaCote d'IvoireCroatiaCubaCyprusCzech RepublicDenmarkDominicaDominican RepublicEarly-demographic dividendEast Asia & PacificEast Asia & Pacific (excluding high income)East Asia & Pacific (IDA & IBRD countries)EcuadorEgypt, Arab Rep.El SalvadorEquatorial GuineaEritreaEstoniaEuro areaEurope & Central AsiaEurope & Central Asia (excluding high income)Europe & Central Asia (IDA & IBRD countries)European UnionFaroe IslandsFijiFinlandFragile and conflict affected situationsFranceGabonGambia, TheGeorgiaGermanyGhanaGreeceGrenadaGuatemalaGuineaGuinea-BissauGuyanaHaitiHeavily indebted poor countries (HIPC)High incomeHondurasHong Kong SAR, ChinaHungaryIBRD onlyIcelandIDA & IBRD totalIDA blendIDA onlyIDA totalIndiaIndonesiaIran, Islamic Rep.IraqIrelandIsraelItalyJamaicaJapanJordanKazakhstanKenyaKiribatiKorea, Rep.KosovoKuwaitKyrgyz RepublicLao PDRLate-demographic dividendLatin America & Caribbean Latin America & Caribbean (excluding high income)Latin America & the Caribbean (IDA & IBRD countries)LatviaLeast developed countries: UN classificationLebanonLiberiaLibyaLithuaniaLow & middle incomeLow incomeLower middle incomeLuxembourgMacao SAR, ChinaMacedonia, FYRMadagascarMalawiMalaysiaMaldivesMaliMaltaMauritaniaMauritiusMexicoMiddle East & North AfricaMiddle East & North Africa (excluding high income)Middle East & North Africa (IDA & IBRD countries)Middle incomeMoldovaMongoliaMontenegroMoroccoMozambiqueMyanmarNamibiaNepalNetherlandsNew ZealandNicaraguaNigerNigeriaNorth AmericaNorwayOECD membersOmanOther small statesPacific island small statesPakistanPalauPanamaParaguayPeruPhilippinesPolandPortugalPost-demographic dividendPre-demographic dividendPuerto RicoQatarRomaniaRussian FederationRwandaSamoaSaudi ArabiaSenegalSerbiaSeychellesSierra LeoneSingaporeSlovak RepublicSloveniaSmall statesSolomon IslandsSouth AfricaSouth AsiaSouth Asia (IDA & IBRD)South SudanSpainSri LankaSt. Kitts and NevisSt. LuciaSt. Vincent and the GrenadinesSub-Saharan Africa Sub-Saharan Africa (excluding high income)Sub-Saharan Africa (IDA & IBRD countries)SudanSurinameSwazilandSwedenSwitzerlandTajikistanTanzaniaThailandTimor-LesteTogoTongaTrinidad and TobagoTunisiaTurkeyTurkmenistanUgandaUkraineUnited Arab EmiratesUnited KingdomUnited StatesUpper middle incomeUruguayUzbekistanVanuatuVenezuela, RBVietnamWest Bank and GazaWorldYemen, Rep.ZambiaZimbabwe Timeline:
This timeline shows a graph from 1961 to 2016 of Uruguay. No data until 1960. Number of actual observations by date: 56.
Source name:
World Development Indicators
Source organization:
World Bank national accounts data, and OECD National Accounts data files.
Categories, topics:
Economy & Growth, Trade
Last updated:
apr 23, 2017
Indicators value changes by year
Minimum:
830.009 mln
jan 1, 1961
Maximum:
12.039 bln
jan 1, 2015
At the date of observation
Value
Absolute change
Change from previous value
jan 1, 1961
830.009 mln
+830.009 mln
0.0%
jan 1, 1962
1.02 bln
+189.99 mln
22.89%
jan 1, 1963
875.667 mln
-144.332 mln
-14.15%
jan 1, 1964
913.977 mln
+38.31 mln
4.37%
jan 1, 1965
949.185 mln
+35.209 mln
3.85%
jan 1, 1966
1.215 bln
+265.839 mln
28.01%
jan 1, 1967
1.077 bln
-137.756 mln
-11.34%
jan 1, 1968
1.005 bln
-71.976 mln
-6.68%
jan 1, 1969
1.151 bln
+145.88 mln
14.51%
jan 1, 1970
1.15 bln
-1.542 mln
-0.13%
jan 1, 1971
1.181 bln
+31.727 mln
2.76%
jan 1, 1972
1.124 bln
-57.154 mln
-4.84%
jan 1, 1973
1.104 bln
-20.127 mln
-1.79%
jan 1, 1974
1.101 bln
-3.487 mln
-0.32%
jan 1, 1975
1.328 bln
+227.627 mln
20.68%
jan 1, 1976
1.582 bln
+253.566 mln
19.09%
jan 1, 1977
1.915 bln
+332.93 mln
21.05%
jan 1, 1978
2.052 bln
+137.042 mln
7.16%
jan 1, 1979
2.141 bln
+89.037 mln
4.34%
jan 1, 1980
2.281 bln
+140.523 mln
6.56%
jan 1, 1981
2.364 bln
+82.46 mln
3.61%
jan 1, 1982
2.51 bln
+145.944 mln
6.17%
jan 1, 1983
2.246 bln
-264.015 mln
-10.52%
jan 1, 1984
2.593 bln
+346.86 mln
15.45%
jan 1, 1985
2.55 bln
-42.407 mln
-1.64%
jan 1, 1986
2.704 bln
+154.206 mln
6.05%
jan 1, 1987
3.015 bln
+310.829 mln
11.49%
jan 1, 1988
2.76 bln
-255.303 mln
-8.47%
jan 1, 1989
2.956 bln
+196.095 mln
7.11%
jan 1, 1990
3.178 bln
+221.815 mln
7.5%
jan 1, 1991
3.613 bln
+435.402 mln
13.7%
jan 1, 1992
3.712 bln
+98.335 mln
2.72%
jan 1, 1993
4.05 bln
+338.506 mln
9.12%
jan 1, 1994
4.399 bln
+349.381 mln
8.63%
jan 1, 1995
5.066 bln
+666.252 mln
15.14%
jan 1, 1996
4.972 bln
-94.077 mln
-1.86%
jan 1, 1997
5.483 bln
+511.182 mln
10.28%
jan 1, 1998
6.197 bln
+713.952 mln
13.02%
jan 1, 1999
6.217 bln
+20.714 mln
0.33%
jan 1, 2000
5.76 bln
-457.785 mln
-7.36%
jan 1, 2001
6.126 bln
+366.412 mln
6.36%
jan 1, 2002
5.567 bln
-559.228 mln
-9.13%
jan 1, 2003
4.991 bln
-576.029 mln
-10.35%
jan 1, 2004
5.201 bln
+210.02 mln
4.21%
jan 1, 2005
6.784 bln
+1.583 bln
30.44%
jan 1, 2006
7.892 bln
+1.108 bln
16.34%
jan 1, 2007
8.336 bln
+443.208 mln
5.62%
jan 1, 2008
8.734 bln
+398.482 mln
4.78%
jan 1, 2009
9.479 bln
+745.123 mln
8.53%
jan 1, 2010
9.901 bln
+422.209 mln
4.45%
jan 1, 2011
10.612 bln
+710.86 mln
7.18%
jan 1, 2012
11.228 bln
+615.915 mln
5.8%
jan 1, 2013
11.637 bln
+408.907 mln
3.64%
jan 1, 2014
11.63 bln
-7.143 mln
-0.06%
jan 1, 2015
12.039 bln
+408.765 mln
3.51%
jan 1, 2016
11.894 bln
-144.854 mln
-1.2%
Ranking of countries by current statistics by years


Comments: