29
/
en
AIzaSyAYiBZKx7MnpbEhh9jyipgxe19OcubqV5w
April 1, 2024
264531
Togo
TGO
true
2
1
Exports of goods and services (constant 2010 US$)
2016,2015,2014,2013,2012,2011,2010,2009,2008,2007,2006,2005,2004,2003,2002,2001,2000,1999,1998,1997,1996,1995,1994,1993,1992,1991,1990,1989,1988,1987,1986,1985,1984,1983,1982,1981,1980,1979,1978,1977,1976,1975,1974,1973,1972,1971,1970,1969,1968,1967,1966,1965,1964,1963,1962,1961
This statistics in other country:
AfghanistanAlbaniaAlgeriaAngolaAntigua and BarbudaArab WorldArgentinaArmeniaArubaAustraliaAustriaAzerbaijanBahamas, TheBahrainBangladeshBarbadosBelarusBelgiumBelizeBeninBermudaBhutanBoliviaBosnia and HerzegovinaBotswanaBrazilBrunei DarussalamBulgariaBurkina FasoBurundiCabo VerdeCambodiaCameroonCanadaCaribbean small statesCentral African RepublicCentral Europe and the BalticsChadChileChinaColombiaComorosCongo, Dem. Rep.Congo, Rep.Costa RicaCote d'IvoireCroatiaCubaCyprusCzech RepublicDenmarkDominicaDominican RepublicEarly-demographic dividendEast Asia & PacificEast Asia & Pacific (excluding high income)East Asia & Pacific (IDA & IBRD countries)EcuadorEgypt, Arab Rep.El SalvadorEquatorial GuineaEritreaEstoniaEuro areaEurope & Central AsiaEurope & Central Asia (excluding high income)Europe & Central Asia (IDA & IBRD countries)European UnionFaroe IslandsFijiFinlandFragile and conflict affected situationsFranceGabonGambia, TheGeorgiaGermanyGhanaGreeceGrenadaGuatemalaGuineaGuinea-BissauGuyanaHaitiHeavily indebted poor countries (HIPC)High incomeHondurasHong Kong SAR, ChinaHungaryIBRD onlyIcelandIDA & IBRD totalIDA blendIDA onlyIDA totalIndiaIndonesiaIran, Islamic Rep.IraqIrelandIsraelItalyJamaicaJapanJordanKazakhstanKenyaKiribatiKorea, Rep.KosovoKuwaitKyrgyz RepublicLao PDRLate-demographic dividendLatin America & Caribbean Latin America & Caribbean (excluding high income)Latin America & the Caribbean (IDA & IBRD countries)LatviaLeast developed countries: UN classificationLebanonLiberiaLibyaLithuaniaLow & middle incomeLow incomeLower middle incomeLuxembourgMacao SAR, ChinaMacedonia, FYRMadagascarMalawiMalaysiaMaldivesMaliMaltaMauritaniaMauritiusMexicoMiddle East & North AfricaMiddle East & North Africa (excluding high income)Middle East & North Africa (IDA & IBRD countries)Middle incomeMoldovaMongoliaMontenegroMoroccoMozambiqueMyanmarNamibiaNepalNetherlandsNew ZealandNicaraguaNigerNigeriaNorth AmericaNorwayOECD membersOmanOther small statesPacific island small statesPakistanPalauPanamaParaguayPeruPhilippinesPolandPortugalPost-demographic dividendPre-demographic dividendPuerto RicoQatarRomaniaRussian FederationRwandaSamoaSaudi ArabiaSenegalSerbiaSeychellesSierra LeoneSingaporeSlovak RepublicSloveniaSmall statesSolomon IslandsSouth AfricaSouth AsiaSouth Asia (IDA & IBRD)South SudanSpainSri LankaSt. Kitts and NevisSt. LuciaSt. Vincent and the GrenadinesSub-Saharan Africa Sub-Saharan Africa (excluding high income)Sub-Saharan Africa (IDA & IBRD countries)SudanSurinameSwazilandSwedenSwitzerlandTajikistanTanzaniaThailandTimor-LesteTogoTongaTrinidad and TobagoTunisiaTurkeyTurkmenistanUgandaUkraineUnited Arab EmiratesUnited KingdomUnited StatesUpper middle incomeUruguayUzbekistanVanuatuVenezuela, RBVietnamWest Bank and GazaWorldYemen, Rep.ZambiaZimbabwe Timeline:
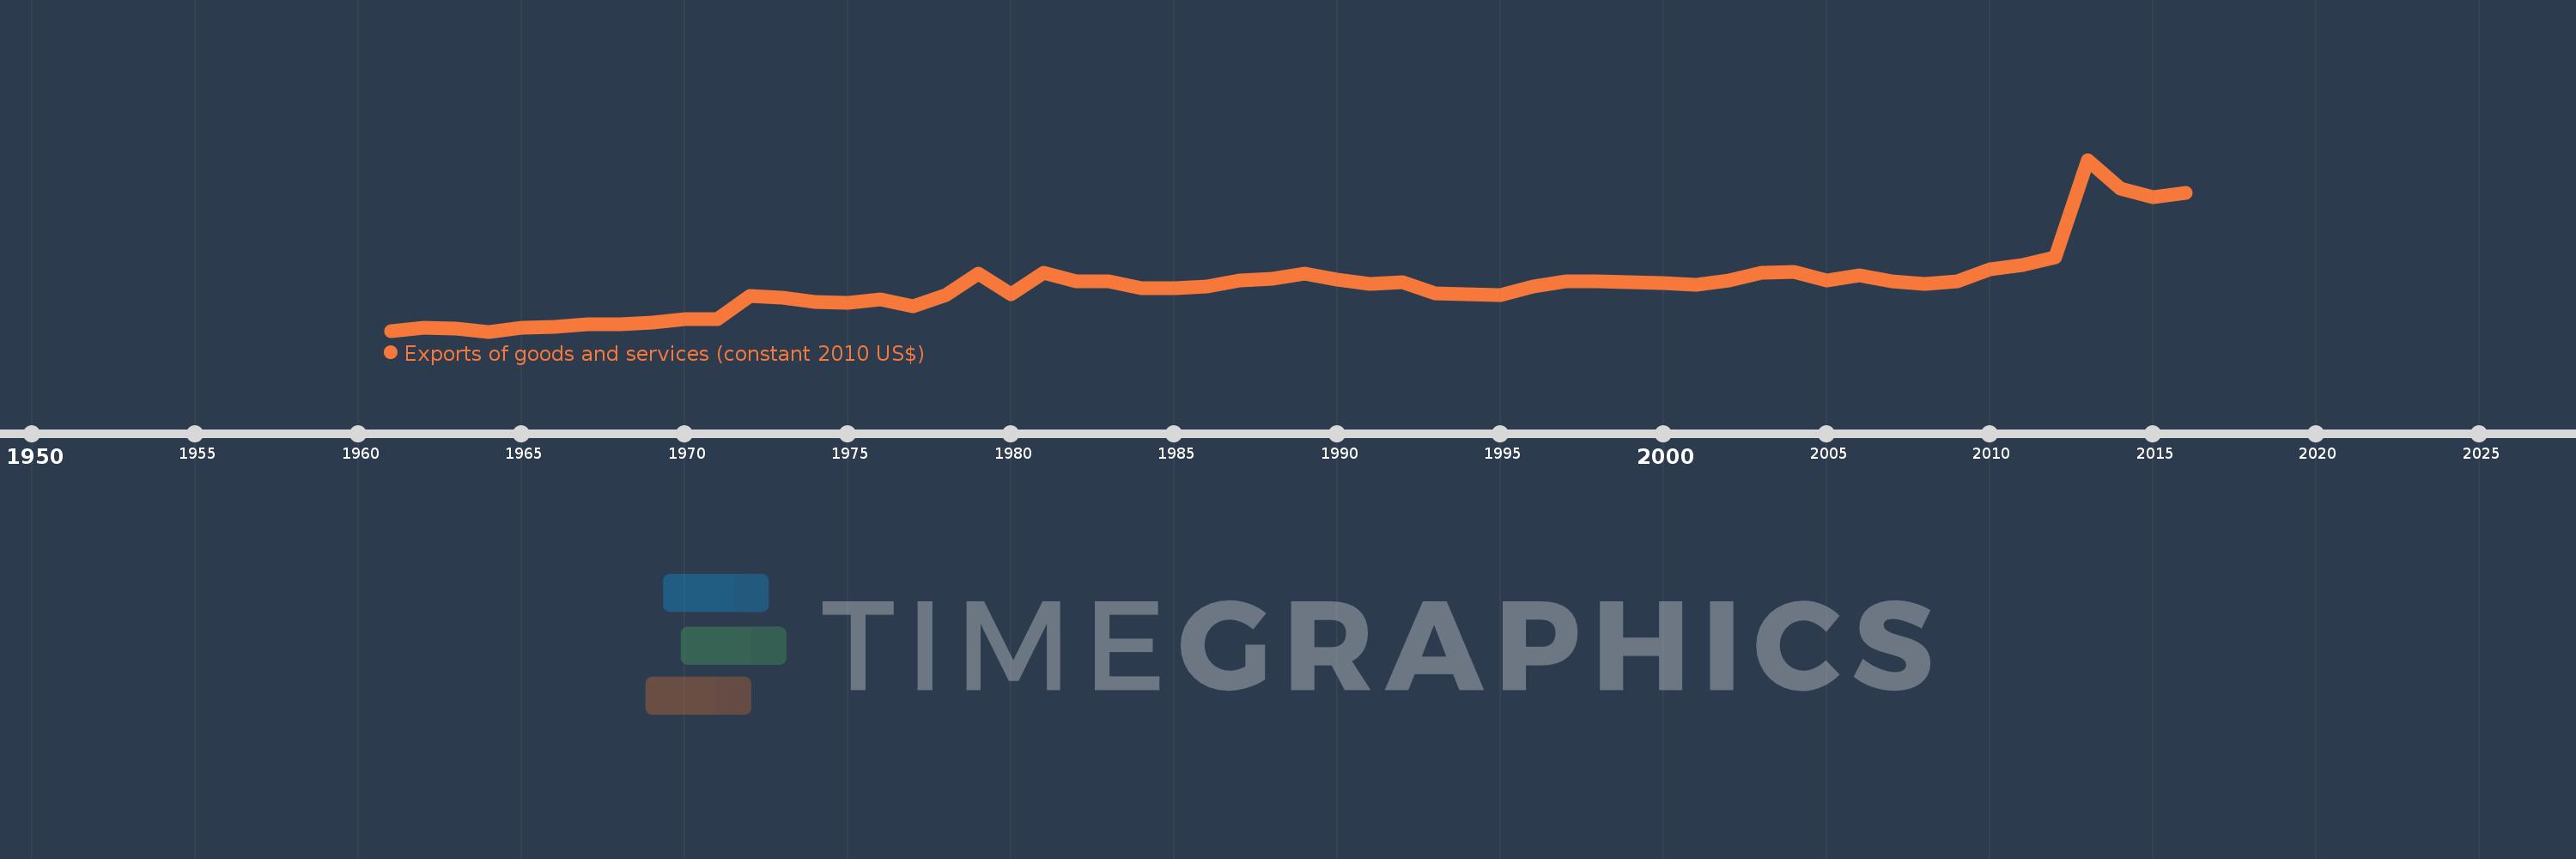
This timeline shows a graph from 1961 to 2016 of Togo. No data until 1960. Number of actual observations by date: 56.
Source name:
World Development Indicators
Source organization:
World Bank national accounts data, and OECD National Accounts data files.
Categories, topics:
Economy & Growth, Trade
Last updated:
apr 23, 2017
Indicators value changes by year
Minimum:
128.067 mln
jan 1, 1964
Maximum:
3.082 bln
jan 1, 2013
At the date of observation
Value
Absolute change
Change from previous value
jan 1, 1961
134.567 mln
+134.567 mln
0.0%
jan 1, 1962
189.825 mln
+55.258 mln
41.06%
jan 1, 1963
180.074 mln
-9.751 mln
-5.14%
jan 1, 1964
128.067 mln
-52.007 mln
-28.88%
jan 1, 1965
193.075 mln
+65.009 mln
50.76%
jan 1, 1966
209.833 mln
+16.757 mln
8.68%
jan 1, 1967
250.487 mln
+40.655 mln
19.37%
jan 1, 1968
255.078 mln
+4.59 mln
1.83%
jan 1, 1969
285.241 mln
+30.163 mln
11.83%
jan 1, 1970
339.011 mln
+53.77 mln
18.85%
jan 1, 1971
344.257 mln
+5.246 mln
1.55%
jan 1, 1972
740.892 mln
+396.636 mln
115.22%
jan 1, 1973
715.933 mln
-24.96 mln
-3.37%
jan 1, 1974
641.056 mln
-74.877 mln
-10.46%
jan 1, 1975
620.038 mln
-21.018 mln
-3.28%
jan 1, 1976
687.032 mln
+66.994 mln
10.8%
jan 1, 1977
570.119 mln
-116.913 mln
-17.02%
jan 1, 1978
754.029 mln
+183.91 mln
32.26%
jan 1, 1979
1.122 bln
+368.324 mln
48.85%
jan 1, 1980
775.047 mln
-347.306 mln
-30.94%
jan 1, 1981
1.134 bln
+358.624 mln
46.27%
jan 1, 1982
989.368 mln
-144.303 mln
-12.73%
jan 1, 1983
990.311 mln
+943.151K
0.1%
jan 1, 1984
877.132 mln
-113.179 mln
-11.43%
jan 1, 1985
879.017 mln
+1.885 mln
0.21%
jan 1, 1986
908.257 mln
+29.239 mln
3.33%
jan 1, 1987
1.001 bln
+92.351 mln
10.17%
jan 1, 1988
1.038 bln
+37.846 mln
3.78%
jan 1, 1989
1.132 bln
+93.378 mln
8.99%
jan 1, 1990
1.021 bln
-110.59 mln
-9.77%
jan 1, 1991
940.436 mln
-80.806 mln
-7.91%
jan 1, 1992
982.755 mln
+42.32 mln
4.5%
jan 1, 1993
790.135 mln
-192.62 mln
-19.6%
jan 1, 1994
764.851 mln
-25.284 mln
-3.2%
jan 1, 1995
751.083 mln
-13.767 mln
-1.8%
jan 1, 1996
905.807 mln
+154.723 mln
20.6%
jan 1, 1997
991.567 mln
+85.76 mln
9.47%
jan 1, 1998
991.567 mln
0.0
0.0%
jan 1, 1999
980.659 mln
-10.907 mln
-1.1%
jan 1, 2000
967.911 mln
-12.749 mln
-1.3%
jan 1, 2001
928.226 mln
-39.684 mln
-4.1%
jan 1, 2002
1.01 bln
+81.433 mln
8.77%
jan 1, 2003
1.132 bln
+122.744 mln
12.16%
jan 1, 2004
1.151 bln
+19.026 mln
1.68%
jan 1, 2005
1.004 bln
-147.786 mln
-12.84%
jan 1, 2006
1.098 bln
+94.446 mln
9.41%
jan 1, 2007
993.529 mln
-104.559 mln
-9.52%
jan 1, 2008
954.675 mln
-38.854 mln
-3.91%
jan 1, 2009
988.335 mln
+33.66 mln
3.53%
jan 1, 2010
1.194 bln
+205.598 mln
20.8%
jan 1, 2011
1.274 bln
+80.445 mln
6.74%
jan 1, 2012
1.411 bln
+136.785 mln
10.73%
jan 1, 2013
3.082 bln
+1.671 bln
118.4%
jan 1, 2014
2.581 bln
-501.303 mln
-16.27%
jan 1, 2015
2.439 bln
-141.814 mln
-5.5%
jan 1, 2016
2.507 bln
+68.454 mln
2.81%
Ranking of countries by current statistics by years


Comments: