29
/
en
AIzaSyAYiBZKx7MnpbEhh9jyipgxe19OcubqV5w
April 1, 2024
124727
Egypt, Arab Rep.
EGY
true
2
1
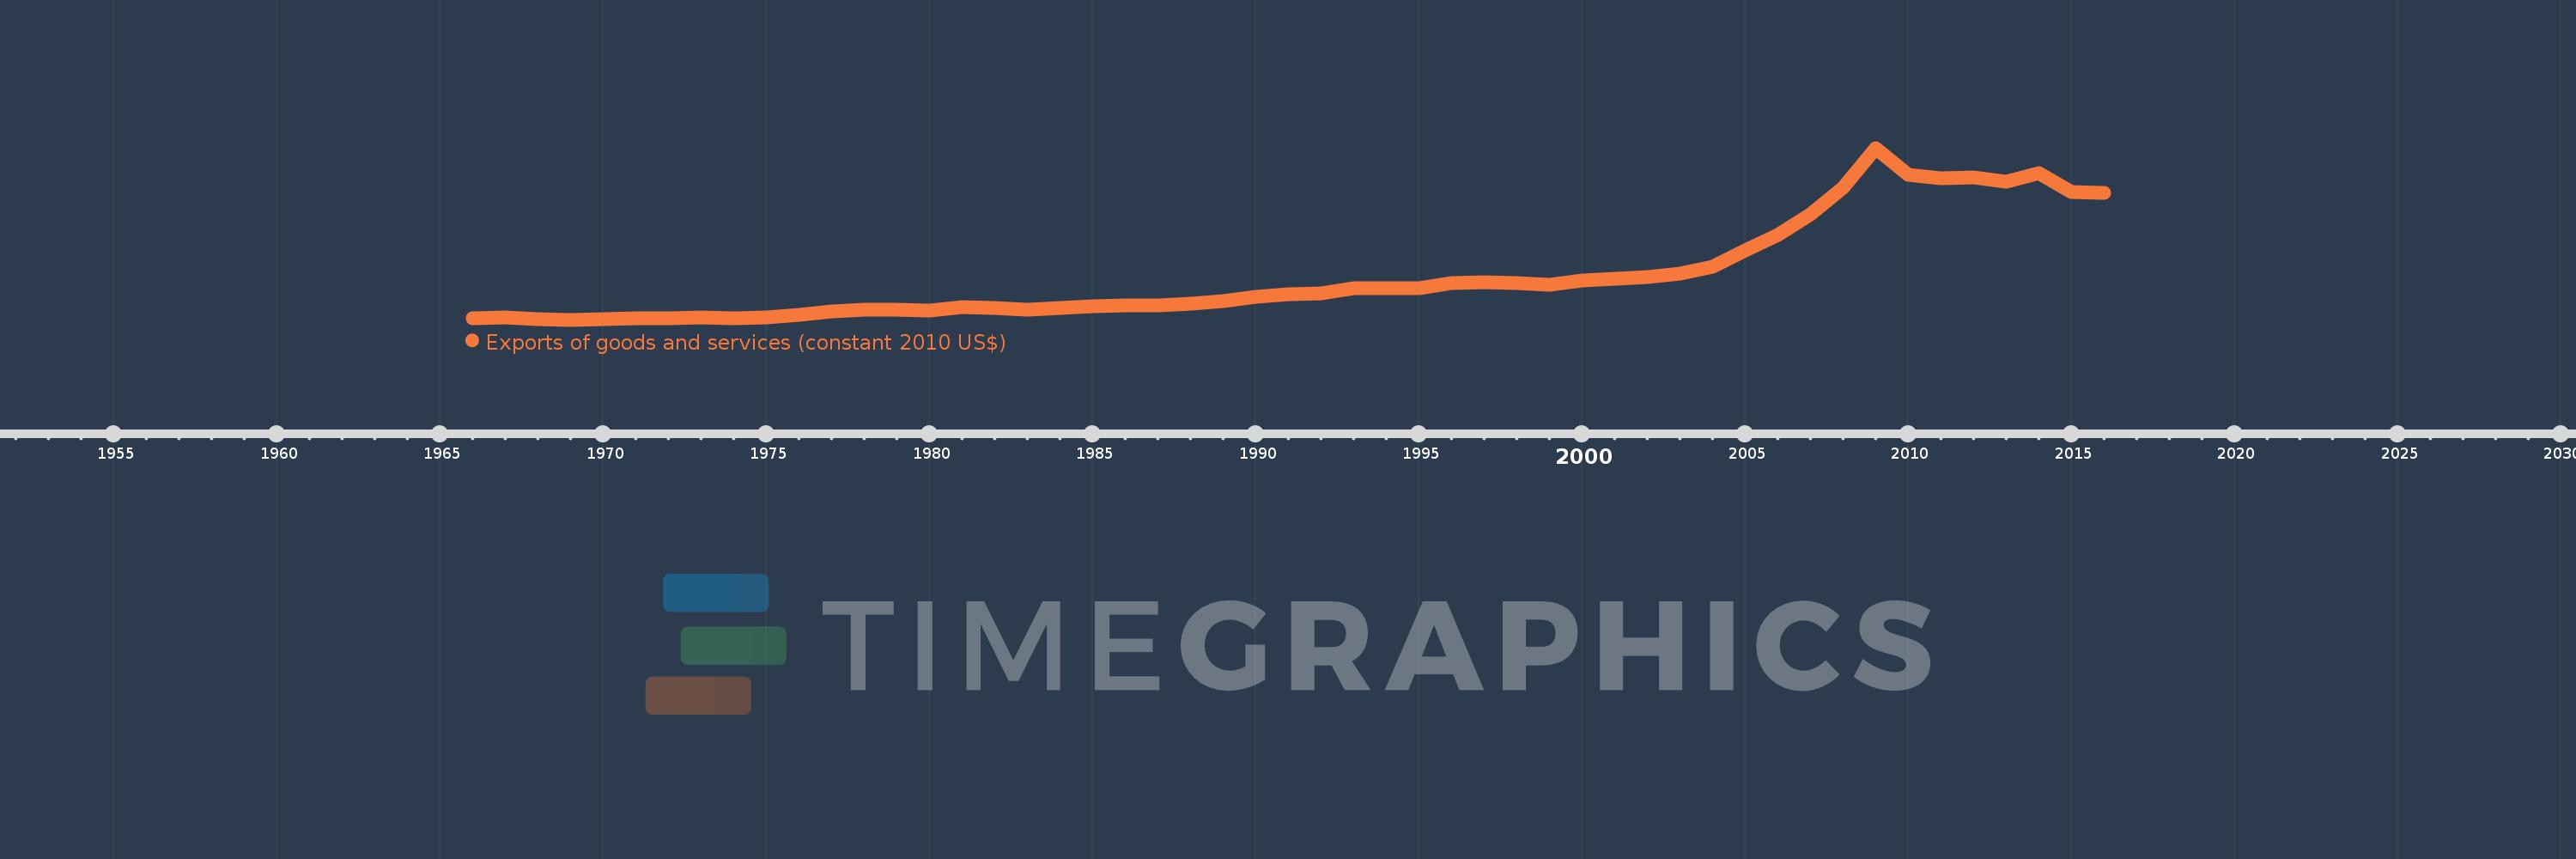
Exports of goods and services (constant 2010 US$)
2016,2015,2014,2013,2012,2011,2010,2009,2008,2007,2006,2005,2004,2003,2002,2001,2000,1999,1998,1997,1996,1995,1994,1993,1992,1991,1990,1989,1988,1987,1986,1985,1984,1983,1982,1981,1980,1979,1978,1977,1976,1975,1974,1973,1972,1971,1970,1969,1968,1967,1966
This statistics in other country:
AfghanistanAlbaniaAlgeriaAngolaAntigua and BarbudaArab WorldArgentinaArmeniaArubaAustraliaAustriaAzerbaijanBahamas, TheBahrainBangladeshBarbadosBelarusBelgiumBelizeBeninBermudaBhutanBoliviaBosnia and HerzegovinaBotswanaBrazilBrunei DarussalamBulgariaBurkina FasoBurundiCabo VerdeCambodiaCameroonCanadaCaribbean small statesCentral African RepublicCentral Europe and the BalticsChadChileChinaColombiaComorosCongo, Dem. Rep.Congo, Rep.Costa RicaCote d'IvoireCroatiaCubaCyprusCzech RepublicDenmarkDominicaDominican RepublicEarly-demographic dividendEast Asia & PacificEast Asia & Pacific (excluding high income)East Asia & Pacific (IDA & IBRD countries)EcuadorEgypt, Arab Rep.El SalvadorEquatorial GuineaEritreaEstoniaEuro areaEurope & Central AsiaEurope & Central Asia (excluding high income)Europe & Central Asia (IDA & IBRD countries)European UnionFaroe IslandsFijiFinlandFragile and conflict affected situationsFranceGabonGambia, TheGeorgiaGermanyGhanaGreeceGrenadaGuatemalaGuineaGuinea-BissauGuyanaHaitiHeavily indebted poor countries (HIPC)High incomeHondurasHong Kong SAR, ChinaHungaryIBRD onlyIcelandIDA & IBRD totalIDA blendIDA onlyIDA totalIndiaIndonesiaIran, Islamic Rep.IraqIrelandIsraelItalyJamaicaJapanJordanKazakhstanKenyaKiribatiKorea, Rep.KosovoKuwaitKyrgyz RepublicLao PDRLate-demographic dividendLatin America & Caribbean Latin America & Caribbean (excluding high income)Latin America & the Caribbean (IDA & IBRD countries)LatviaLeast developed countries: UN classificationLebanonLiberiaLibyaLithuaniaLow & middle incomeLow incomeLower middle incomeLuxembourgMacao SAR, ChinaMacedonia, FYRMadagascarMalawiMalaysiaMaldivesMaliMaltaMauritaniaMauritiusMexicoMiddle East & North AfricaMiddle East & North Africa (excluding high income)Middle East & North Africa (IDA & IBRD countries)Middle incomeMoldovaMongoliaMontenegroMoroccoMozambiqueMyanmarNamibiaNepalNetherlandsNew ZealandNicaraguaNigerNigeriaNorth AmericaNorwayOECD membersOmanOther small statesPacific island small statesPakistanPalauPanamaParaguayPeruPhilippinesPolandPortugalPost-demographic dividendPre-demographic dividendPuerto RicoQatarRomaniaRussian FederationRwandaSamoaSaudi ArabiaSenegalSerbiaSeychellesSierra LeoneSingaporeSlovak RepublicSloveniaSmall statesSolomon IslandsSouth AfricaSouth AsiaSouth Asia (IDA & IBRD)South SudanSpainSri LankaSt. Kitts and NevisSt. LuciaSt. Vincent and the GrenadinesSub-Saharan Africa Sub-Saharan Africa (excluding high income)Sub-Saharan Africa (IDA & IBRD countries)SudanSurinameSwazilandSwedenSwitzerlandTajikistanTanzaniaThailandTimor-LesteTogoTongaTrinidad and TobagoTunisiaTurkeyTurkmenistanUgandaUkraineUnited Arab EmiratesUnited KingdomUnited StatesUpper middle incomeUruguayUzbekistanVanuatuVenezuela, RBVietnamWest Bank and GazaWorldYemen, Rep.ZambiaZimbabwe Timeline:
This timeline shows a graph from 1966 to 2016 of Egypt, Arab Rep.. No data until 1965. Number of actual observations by date: 51.
Source name:
World Development Indicators
Source organization:
World Bank national accounts data, and OECD National Accounts data files.
Categories, topics:
Economy & Growth, Trade
Last updated:
apr 23, 2017
Indicators value changes by year
Minimum:
2.802 bln
jan 1, 1969
Maximum:
56.296 bln
jan 1, 2009
At the date of observation
Value
Absolute change
Change from previous value
jan 1, 1966
3.325 bln
+3.325 bln
0.0%
jan 1, 1967
3.468 bln
+143.638 mln
4.32%
jan 1, 1968
3.05 bln
-418.379 mln
-12.06%
jan 1, 1969
2.802 bln
-247.75 mln
-8.12%
jan 1, 1970
3.05 bln
+247.75 mln
8.84%
jan 1, 1971
3.352 bln
+301.734 mln
9.89%
jan 1, 1972
3.306 bln
-46.272 mln
-1.38%
jan 1, 1973
3.473 bln
+167.737 mln
5.07%
jan 1, 1974
3.299 bln
-174.485 mln
-5.02%
jan 1, 1975
3.43 bln
+131.105 mln
3.97%
jan 1, 1976
4.229 bln
+799.162 mln
23.3%
jan 1, 1977
5.394 bln
+1.165 bln
27.54%
jan 1, 1978
5.913 bln
+519.6 mln
9.63%
jan 1, 1979
5.928 bln
+14.46 mln
0.24%
jan 1, 1980
5.718 bln
-210.154 mln
-3.55%
jan 1, 1981
6.69 bln
+972.684 mln
17.01%
jan 1, 1982
6.592 bln
-98.329 mln
-1.47%
jan 1, 1983
5.906 bln
-686.373 mln
-10.41%
jan 1, 1984
6.54 bln
+634.316 mln
10.74%
jan 1, 1985
6.94 bln
+400.063 mln
6.12%
jan 1, 1986
7.224 bln
+284.382 mln
4.1%
jan 1, 1987
7.257 bln
+32.776 mln
0.45%
jan 1, 1988
7.718 bln
+460.796 mln
6.35%
jan 1, 1989
8.581 bln
+862.702 mln
11.18%
jan 1, 1990
10.011 bln
+1.43 bln
16.67%
jan 1, 1991
10.726 bln
+715.046 mln
7.14%
jan 1, 1992
11.083 bln
+357.523 mln
3.33%
jan 1, 1993
12.513 bln
+1.43 bln
12.9%
jan 1, 1994
12.672 bln
+158.396 mln
1.27%
jan 1, 1995
12.735 bln
+63.358 mln
0.5%
jan 1, 1996
14.192 bln
+1.457 bln
11.44%
jan 1, 1997
14.436 bln
+243.93 mln
1.72%
jan 1, 1998
14.287 bln
-148.892 mln
-1.03%
jan 1, 1999
13.774 bln
-513.317 mln
-3.59%
jan 1, 2000
15.029 bln
+1.255 bln
9.11%
jan 1, 2001
15.599 bln
+570.353 mln
3.8%
jan 1, 2002
16.112 bln
+513.317 mln
3.29%
jan 1, 2003
17.042 bln
+929.363 mln
5.77%
jan 1, 2004
19.397 bln
+2.355 bln
13.82%
jan 1, 2005
24.281 bln
+4.884 bln
25.18%
jan 1, 2006
29.261 bln
+4.981 bln
20.51%
jan 1, 2007
35.488 bln
+6.227 bln
21.28%
jan 1, 2008
43.817 bln
+8.328 bln
23.47%
jan 1, 2009
56.296 bln
+12.479 bln
28.48%
jan 1, 2010
48.053 bln
-8.243 bln
-14.64%
jan 1, 2011
46.731 bln
-1.322 bln
-2.75%
jan 1, 2012
47.002 bln
+271.205 mln
0.58%
jan 1, 2013
45.801 bln
-1.201 bln
-2.56%
jan 1, 2014
48.37 bln
+2.569 bln
5.61%
jan 1, 2015
42.632 bln
-5.738 bln
-11.86%
jan 1, 2016
42.365 bln
-266.866 mln
-0.63%
Ranking of countries by current statistics by years


Comments: