29
/
en
AIzaSyAYiBZKx7MnpbEhh9jyipgxe19OcubqV5w
April 1, 2024
287137
Zimbabwe
ZWE
true
2
1
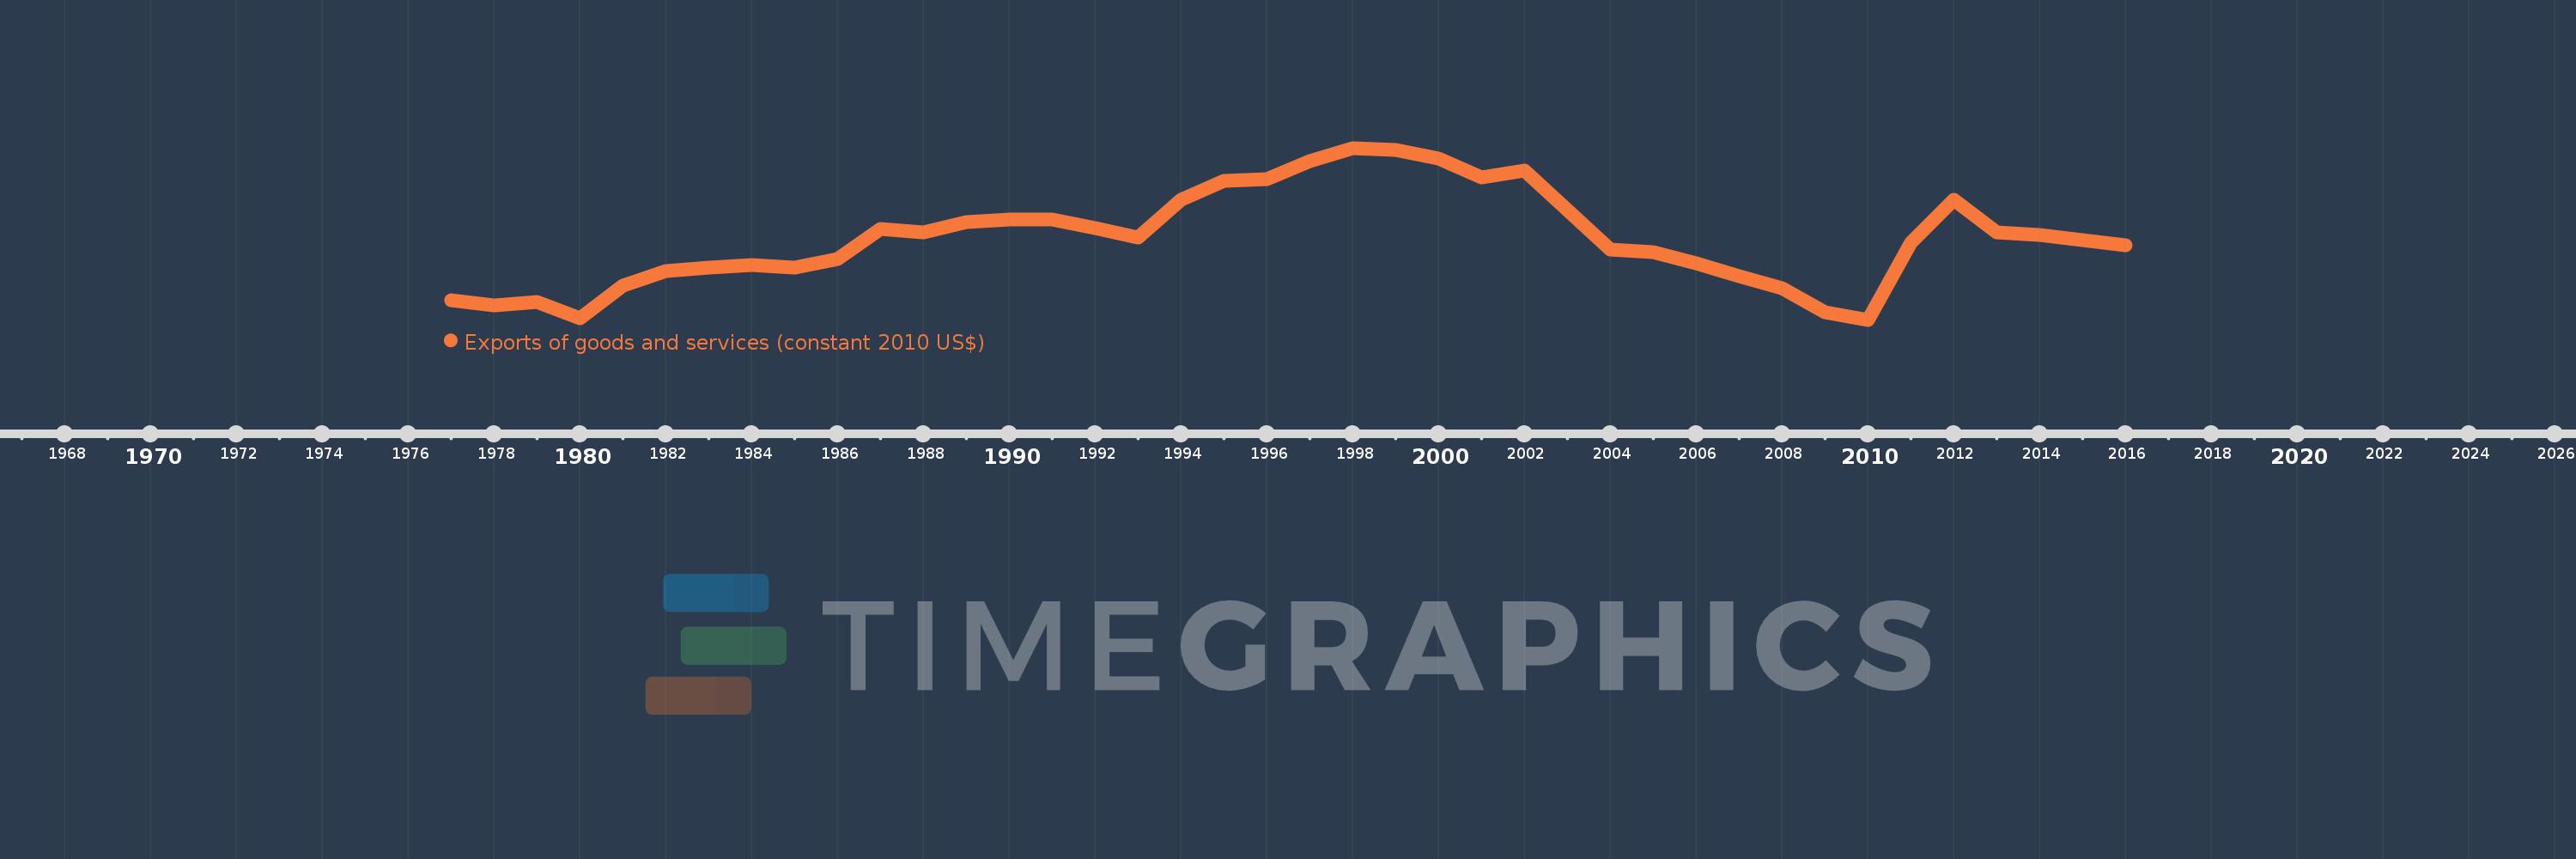
Exports of goods and services (constant 2010 US$)
2016,2015,2014,2013,2012,2011,2010,2009,2008,2007,2006,2005,2004,2003,2002,2001,2000,1999,1998,1997,1996,1995,1994,1993,1992,1991,1990,1989,1988,1987,1986,1985,1984,1983,1982,1981,1980,1979,1978,1977
This statistics in other country:
AfghanistanAlbaniaAlgeriaAngolaAntigua and BarbudaArab WorldArgentinaArmeniaArubaAustraliaAustriaAzerbaijanBahamas, TheBahrainBangladeshBarbadosBelarusBelgiumBelizeBeninBermudaBhutanBoliviaBosnia and HerzegovinaBotswanaBrazilBrunei DarussalamBulgariaBurkina FasoBurundiCabo VerdeCambodiaCameroonCanadaCaribbean small statesCentral African RepublicCentral Europe and the BalticsChadChileChinaColombiaComorosCongo, Dem. Rep.Congo, Rep.Costa RicaCote d'IvoireCroatiaCubaCyprusCzech RepublicDenmarkDominicaDominican RepublicEarly-demographic dividendEast Asia & PacificEast Asia & Pacific (excluding high income)East Asia & Pacific (IDA & IBRD countries)EcuadorEgypt, Arab Rep.El SalvadorEquatorial GuineaEritreaEstoniaEuro areaEurope & Central AsiaEurope & Central Asia (excluding high income)Europe & Central Asia (IDA & IBRD countries)European UnionFaroe IslandsFijiFinlandFragile and conflict affected situationsFranceGabonGambia, TheGeorgiaGermanyGhanaGreeceGrenadaGuatemalaGuineaGuinea-BissauGuyanaHaitiHeavily indebted poor countries (HIPC)High incomeHondurasHong Kong SAR, ChinaHungaryIBRD onlyIcelandIDA & IBRD totalIDA blendIDA onlyIDA totalIndiaIndonesiaIran, Islamic Rep.IraqIrelandIsraelItalyJamaicaJapanJordanKazakhstanKenyaKiribatiKorea, Rep.KosovoKuwaitKyrgyz RepublicLao PDRLate-demographic dividendLatin America & Caribbean Latin America & Caribbean (excluding high income)Latin America & the Caribbean (IDA & IBRD countries)LatviaLeast developed countries: UN classificationLebanonLiberiaLibyaLithuaniaLow & middle incomeLow incomeLower middle incomeLuxembourgMacao SAR, ChinaMacedonia, FYRMadagascarMalawiMalaysiaMaldivesMaliMaltaMauritaniaMauritiusMexicoMiddle East & North AfricaMiddle East & North Africa (excluding high income)Middle East & North Africa (IDA & IBRD countries)Middle incomeMoldovaMongoliaMontenegroMoroccoMozambiqueMyanmarNamibiaNepalNetherlandsNew ZealandNicaraguaNigerNigeriaNorth AmericaNorwayOECD membersOmanOther small statesPacific island small statesPakistanPalauPanamaParaguayPeruPhilippinesPolandPortugalPost-demographic dividendPre-demographic dividendPuerto RicoQatarRomaniaRussian FederationRwandaSamoaSaudi ArabiaSenegalSerbiaSeychellesSierra LeoneSingaporeSlovak RepublicSloveniaSmall statesSolomon IslandsSouth AfricaSouth AsiaSouth Asia (IDA & IBRD)South SudanSpainSri LankaSt. Kitts and NevisSt. LuciaSt. Vincent and the GrenadinesSub-Saharan Africa Sub-Saharan Africa (excluding high income)Sub-Saharan Africa (IDA & IBRD countries)SudanSurinameSwazilandSwedenSwitzerlandTajikistanTanzaniaThailandTimor-LesteTogoTongaTrinidad and TobagoTunisiaTurkeyTurkmenistanUgandaUkraineUnited Arab EmiratesUnited KingdomUnited StatesUpper middle incomeUruguayUzbekistanVanuatuVenezuela, RBVietnamWest Bank and GazaWorldYemen, Rep.ZambiaZimbabwe Timeline:
This timeline shows a graph from 1977 to 2016 of Zimbabwe. No data until 1976. Number of actual observations by date: 40.
Source name:
World Development Indicators
Source organization:
World Bank national accounts data, and OECD National Accounts data files.
Categories, topics:
Economy & Growth, Trade
Last updated:
apr 23, 2017
Indicators value changes by year
Minimum:
1.798 bln
jan 1, 2010
Maximum:
5.532 bln
jan 1, 1998
At the date of observation
Value
Absolute change
Change from previous value
jan 1, 1977
2.22 bln
+2.22 bln
0.0%
jan 1, 1978
2.107 bln
-113.031 mln
-5.09%
jan 1, 1979
2.19 bln
+83.174 mln
3.95%
jan 1, 1980
1.823 bln
-366.829 mln
-16.75%
jan 1, 1981
2.54 bln
+716.361 mln
39.29%
jan 1, 1982
2.858 bln
+318.125 mln
12.53%
jan 1, 1983
2.933 bln
+75.287 mln
2.63%
jan 1, 1984
2.98 bln
+46.501 mln
1.59%
jan 1, 1985
2.923 bln
-56.834 mln
-1.91%
jan 1, 1986
3.126 bln
+202.995 mln
6.94%
jan 1, 1987
3.776 bln
+650.343 mln
20.8%
jan 1, 1988
3.697 bln
-78.897 mln
-2.09%
jan 1, 1989
3.922 bln
+224.749 mln
6.08%
jan 1, 1990
3.97 bln
+48.102 mln
1.23%
jan 1, 1991
3.968 bln
-1.896 mln
-0.05%
jan 1, 1992
3.794 bln
-173.81 mln
-4.38%
jan 1, 1993
3.593 bln
-201.964 mln
-5.32%
jan 1, 1994
4.411 bln
+818.118 mln
22.77%
jan 1, 1995
4.825 bln
+414.157 mln
9.39%
jan 1, 1996
4.848 bln
+23.503 mln
0.49%
jan 1, 1997
5.243 bln
+394.554 mln
8.14%
jan 1, 1998
5.532 bln
+289.287 mln
5.52%
jan 1, 1999
5.495 bln
-37.563 mln
-0.68%
jan 1, 2000
5.293 bln
-201.258 mln
-3.66%
jan 1, 2001
4.884 bln
-409.297 mln
-7.73%
jan 1, 2002
5.044 bln
+160.011 mln
3.28%
jan 1, 2003
4.188 bln
-855.713 mln
-16.96%
jan 1, 2004
3.332 bln
-855.98 mln
-20.44%
jan 1, 2005
3.264 bln
-68.525 mln
-2.06%
jan 1, 2006
3.024 bln
-239.621 mln
-7.34%
jan 1, 2007
2.754 bln
-270.438 mln
-8.94%
jan 1, 2008
2.484 bln
-269.494 mln
-9.79%
jan 1, 2009
1.96 bln
-523.793 mln
-21.08%
jan 1, 2010
1.798 bln
-162.092 mln
-8.27%
jan 1, 2011
3.466 bln
+1.667 bln
92.7%
jan 1, 2012
4.404 bln
+938.464 mln
27.08%
jan 1, 2013
3.691 bln
-713.174 mln
-16.19%
jan 1, 2014
3.641 bln
-49.54 mln
-1.34%
jan 1, 2015
3.53 bln
-111.741 mln
-3.07%
jan 1, 2016
3.423 bln
-106.949 mln
-3.03%
Ranking of countries by current statistics by years


Comments: