29
/
en
AIzaSyAYiBZKx7MnpbEhh9jyipgxe19OcubqV5w
April 1, 2024
37925
IDA blend
IDB
false
2
1
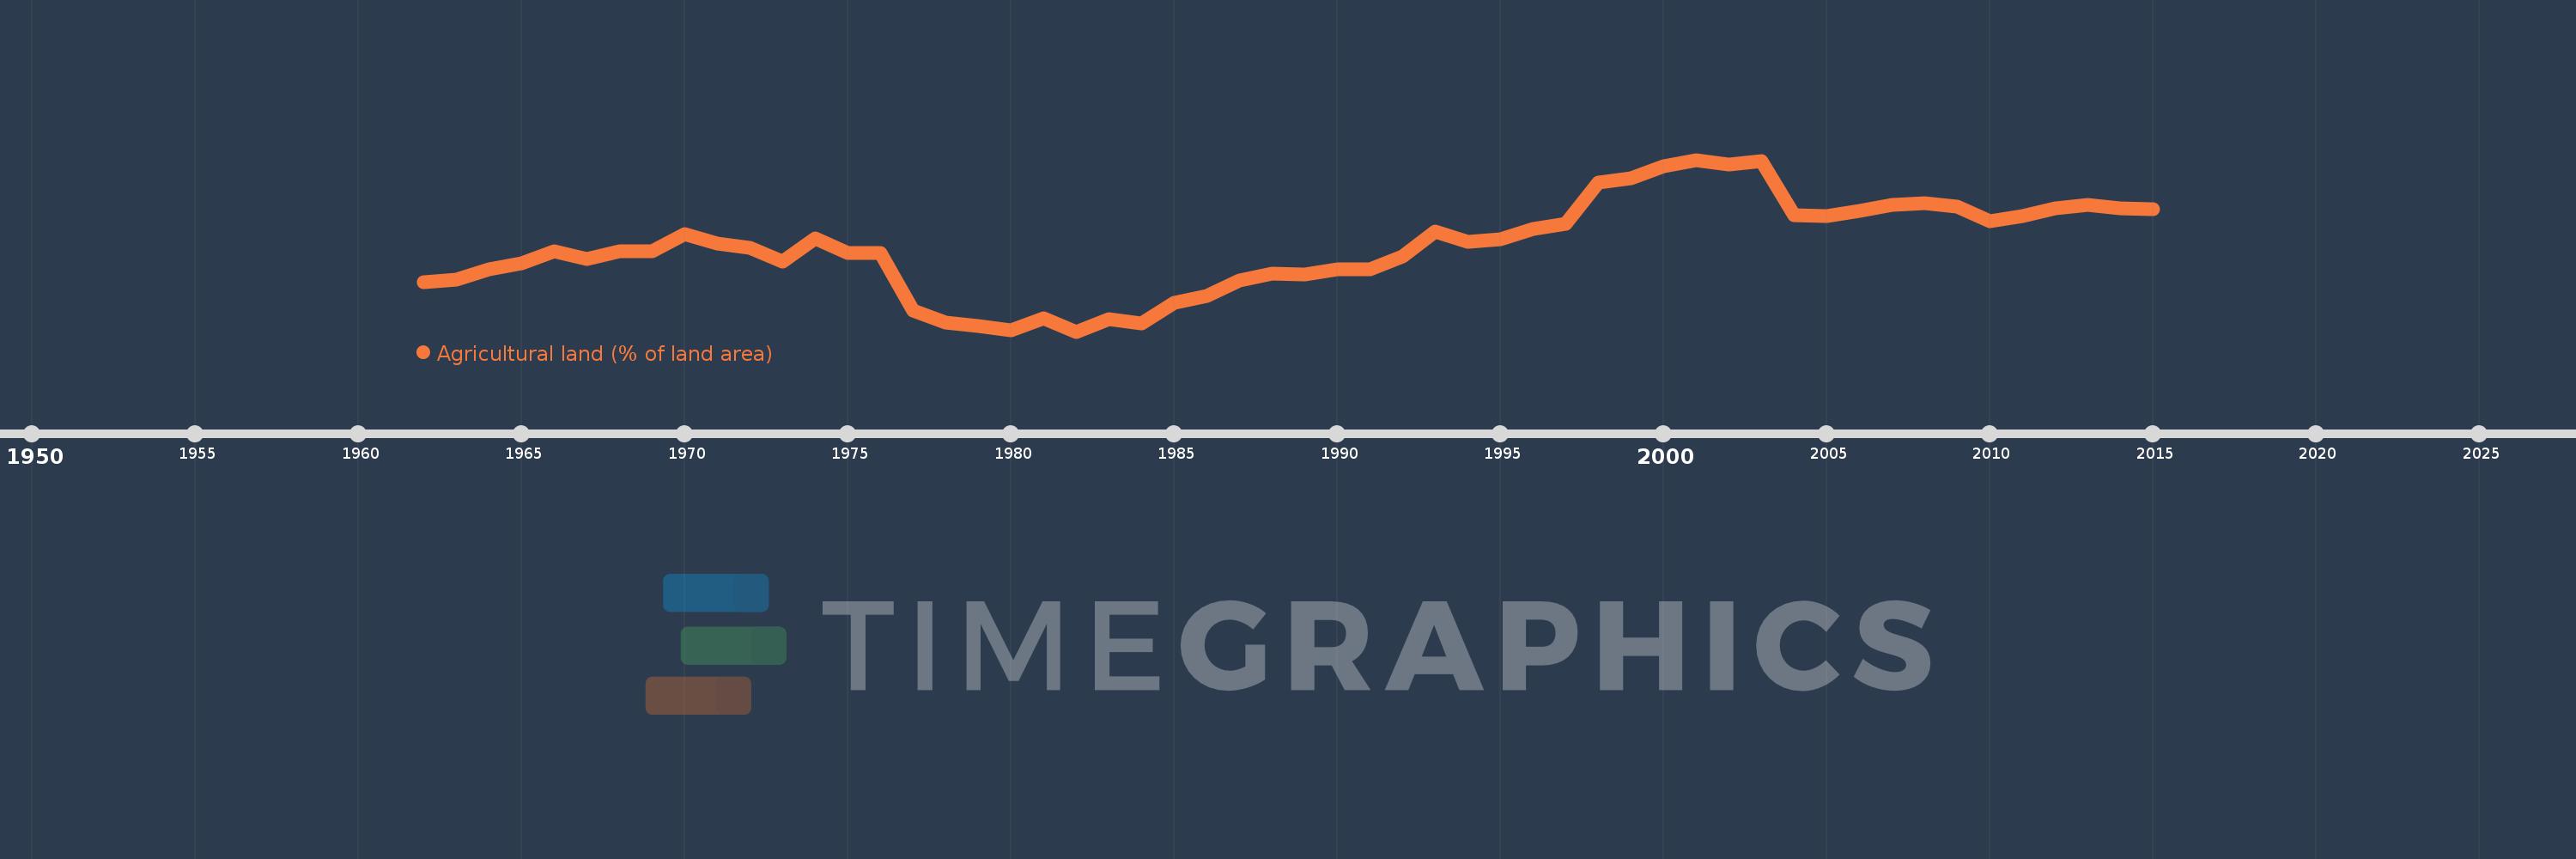
Agricultural land (% of land area)
2015,2014,2013,2012,2011,2010,2009,2008,2007,2006,2005,2004,2003,2002,2001,2000,1999,1998,1997,1996,1995,1994,1993,1992,1991,1990,1989,1988,1987,1986,1985,1984,1983,1982,1981,1980,1979,1978,1977,1976,1975,1974,1973,1972,1971,1970,1969,1968,1967,1966,1965,1964,1963,1962
This statistics in other country:
AfghanistanAlbaniaAlgeriaAmerican SamoaAndorraAngolaAntigua and BarbudaArab WorldArgentinaArmeniaArubaAustraliaAustriaAzerbaijanBahamas, TheBahrainBangladeshBarbadosBelarusBelgiumBelizeBeninBermudaBhutanBoliviaBosnia and HerzegovinaBotswanaBrazilBritish Virgin IslandsBrunei DarussalamBulgariaBurkina FasoBurundiCabo VerdeCambodiaCameroonCanadaCaribbean small statesCayman IslandsCentral African RepublicCentral Europe and the BalticsChadChannel IslandsChileChinaColombiaComorosCongo, Dem. Rep.Congo, Rep.Costa RicaCote d'IvoireCroatiaCubaCyprusCzech RepublicDenmarkDjiboutiDominicaDominican RepublicEarly-demographic dividendEast Asia & PacificEast Asia & Pacific (excluding high income)East Asia & Pacific (IDA & IBRD countries)EcuadorEgypt, Arab Rep.El SalvadorEquatorial GuineaEritreaEstoniaEthiopiaEuro areaEurope & Central AsiaEurope & Central Asia (excluding high income)Europe & Central Asia (IDA & IBRD countries)European UnionFaroe IslandsFijiFinlandFragile and conflict affected situationsFranceFrench PolynesiaGabonGambia, TheGeorgiaGermanyGhanaGreeceGreenlandGrenadaGuamGuatemalaGuineaGuinea-BissauGuyanaHaitiHeavily indebted poor countries (HIPC)High incomeHondurasHong Kong SAR, ChinaHungaryIBRD onlyIcelandIDA & IBRD totalIDA blendIDA onlyIDA totalIndiaIndonesiaIran, Islamic Rep.IraqIrelandIsle of ManIsraelItalyJamaicaJapanJordanKazakhstanKenyaKiribatiKorea, Dem. People’s Rep.Korea, Rep.KosovoKuwaitKyrgyz RepublicLao PDRLate-demographic dividendLatin America & Caribbean Latin America & Caribbean (excluding high income)Latin America & the Caribbean (IDA & IBRD countries)LatviaLeast developed countries: UN classificationLebanonLesothoLiberiaLibyaLiechtensteinLithuaniaLow & middle incomeLow incomeLower middle incomeLuxembourgMacedonia, FYRMadagascarMalawiMalaysiaMaldivesMaliMaltaMarshall IslandsMauritaniaMauritiusMexicoMicronesia, Fed. Sts.Middle East & North AfricaMiddle East & North Africa (excluding high income)Middle East & North Africa (IDA & IBRD countries)Middle incomeMoldovaMongoliaMontenegroMoroccoMozambiqueMyanmarNamibiaNauruNepalNetherlandsNew CaledoniaNew ZealandNicaraguaNigerNigeriaNorth AmericaNorthern Mariana IslandsNorwayOECD membersOmanOther small statesPacific island small statesPakistanPalauPanamaPapua New GuineaParaguayPeruPhilippinesPolandPortugalPost-demographic dividendPre-demographic dividendPuerto RicoQatarRomaniaRussian FederationRwandaSamoaSan MarinoSao Tome and PrincipeSaudi ArabiaSenegalSerbiaSeychellesSierra LeoneSingaporeSlovak RepublicSloveniaSmall statesSolomon IslandsSomaliaSouth AfricaSouth AsiaSouth Asia (IDA & IBRD)SpainSri LankaSt. Kitts and NevisSt. LuciaSt. Vincent and the GrenadinesSub-Saharan Africa Sub-Saharan Africa (excluding high income)Sub-Saharan Africa (IDA & IBRD countries)SudanSurinameSwazilandSwedenSwitzerlandSyrian Arab RepublicTajikistanTanzaniaThailandTimor-LesteTogoTongaTrinidad and TobagoTunisiaTurkeyTurkmenistanTurks and Caicos IslandsTuvaluUgandaUkraineUnited Arab EmiratesUnited KingdomUnited StatesUpper middle incomeUruguayUzbekistanVanuatuVenezuela, RBVietnamVirgin Islands (U.S.)West Bank and GazaWorldYemen, Rep.ZambiaZimbabwe Timeline:
This timeline shows a graph from 1962 to 2015 of IDA blend. No data until 1961. Number of actual observations by date: 54.
Source name:
World Development Indicators
Source organization:
Food and Agriculture Organization, electronic files and web site.
Categories, topics:
Agriculture & Rural Development, Climate Change, Environment
Last updated:
apr 23, 2017
Indicators value changes by year
Minimum:
44.596
jan 1, 1982
Maximum:
51.695
jan 1, 2001
At the date of observation
Value
Absolute change
Change from previous value
jan 1, 1962
46.624
+46.624
0.0%
jan 1, 1963
46.76
+0.136
0.29%
jan 1, 1964
47.155
+0.395
0.84%
jan 1, 1965
47.422
+0.267
0.57%
jan 1, 1966
47.923
+0.502
1.06%
jan 1, 1967
47.591
-0.333
-0.69%
jan 1, 1968
47.916
+0.325
0.68%
jan 1, 1969
47.908
-0.008
-0.02%
jan 1, 1970
48.624
+0.716
1.49%
jan 1, 1971
48.251
-0.373
-0.77%
jan 1, 1972
48.044
-0.207
-0.43%
jan 1, 1973
47.481
-0.564
-1.17%
jan 1, 1974
48.459
+0.978
2.06%
jan 1, 1975
47.828
-0.631
-1.3%
jan 1, 1976
47.83
+0.002
0.0%
jan 1, 1977
45.479
-2.351
-4.91%
jan 1, 1978
44.978
-0.501
-1.1%
jan 1, 1979
44.832
-0.147
-0.33%
jan 1, 1980
44.635
-0.196
-0.44%
jan 1, 1981
45.149
+0.514
1.15%
jan 1, 1982
44.596
-0.553
-1.22%
jan 1, 1983
45.12
+0.524
1.17%
jan 1, 1984
44.938
-0.182
-0.4%
jan 1, 1985
45.77
+0.832
1.85%
jan 1, 1986
46.067
+0.297
0.65%
jan 1, 1987
46.716
+0.649
1.41%
jan 1, 1988
47.008
+0.292
0.63%
jan 1, 1989
46.947
-0.061
-0.13%
jan 1, 1990
47.182
+0.235
0.5%
jan 1, 1991
47.166
-0.016
-0.03%
jan 1, 1992
47.701
+0.535
1.14%
jan 1, 1993
48.726
+1.025
2.15%
jan 1, 1994
48.294
-0.432
-0.89%
jan 1, 1995
48.429
+0.135
0.28%
jan 1, 1996
48.837
+0.408
0.84%
jan 1, 1997
49.046
+0.209
0.43%
jan 1, 1998
50.753
+1.707
3.48%
jan 1, 1999
50.945
+0.192
0.38%
jan 1, 2000
51.413
+0.467
0.92%
jan 1, 2001
51.695
+0.282
0.55%
jan 1, 2002
51.495
-0.2
-0.39%
jan 1, 2003
51.655
+0.16
0.31%
jan 1, 2004
49.405
-2.251
-4.36%
jan 1, 2005
49.367
-0.038
-0.08%
jan 1, 2006
49.568
+0.202
0.41%
jan 1, 2007
49.842
+0.274
0.55%
jan 1, 2008
49.885
+0.043
0.09%
jan 1, 2009
49.756
-0.129
-0.26%
jan 1, 2010
49.146
-0.61
-1.23%
jan 1, 2011
49.386
+0.24
0.49%
jan 1, 2012
49.679
+0.293
0.59%
jan 1, 2013
49.823
+0.144
0.29%
jan 1, 2014
49.693
-0.13
-0.26%
jan 1, 2015
49.648
-0.045
-0.09%
Ranking of countries by current statistics by years


Comments: