29
/
en
AIzaSyAYiBZKx7MnpbEhh9jyipgxe19OcubqV5w
April 1, 2024
62364
World
WLD
false
2
1
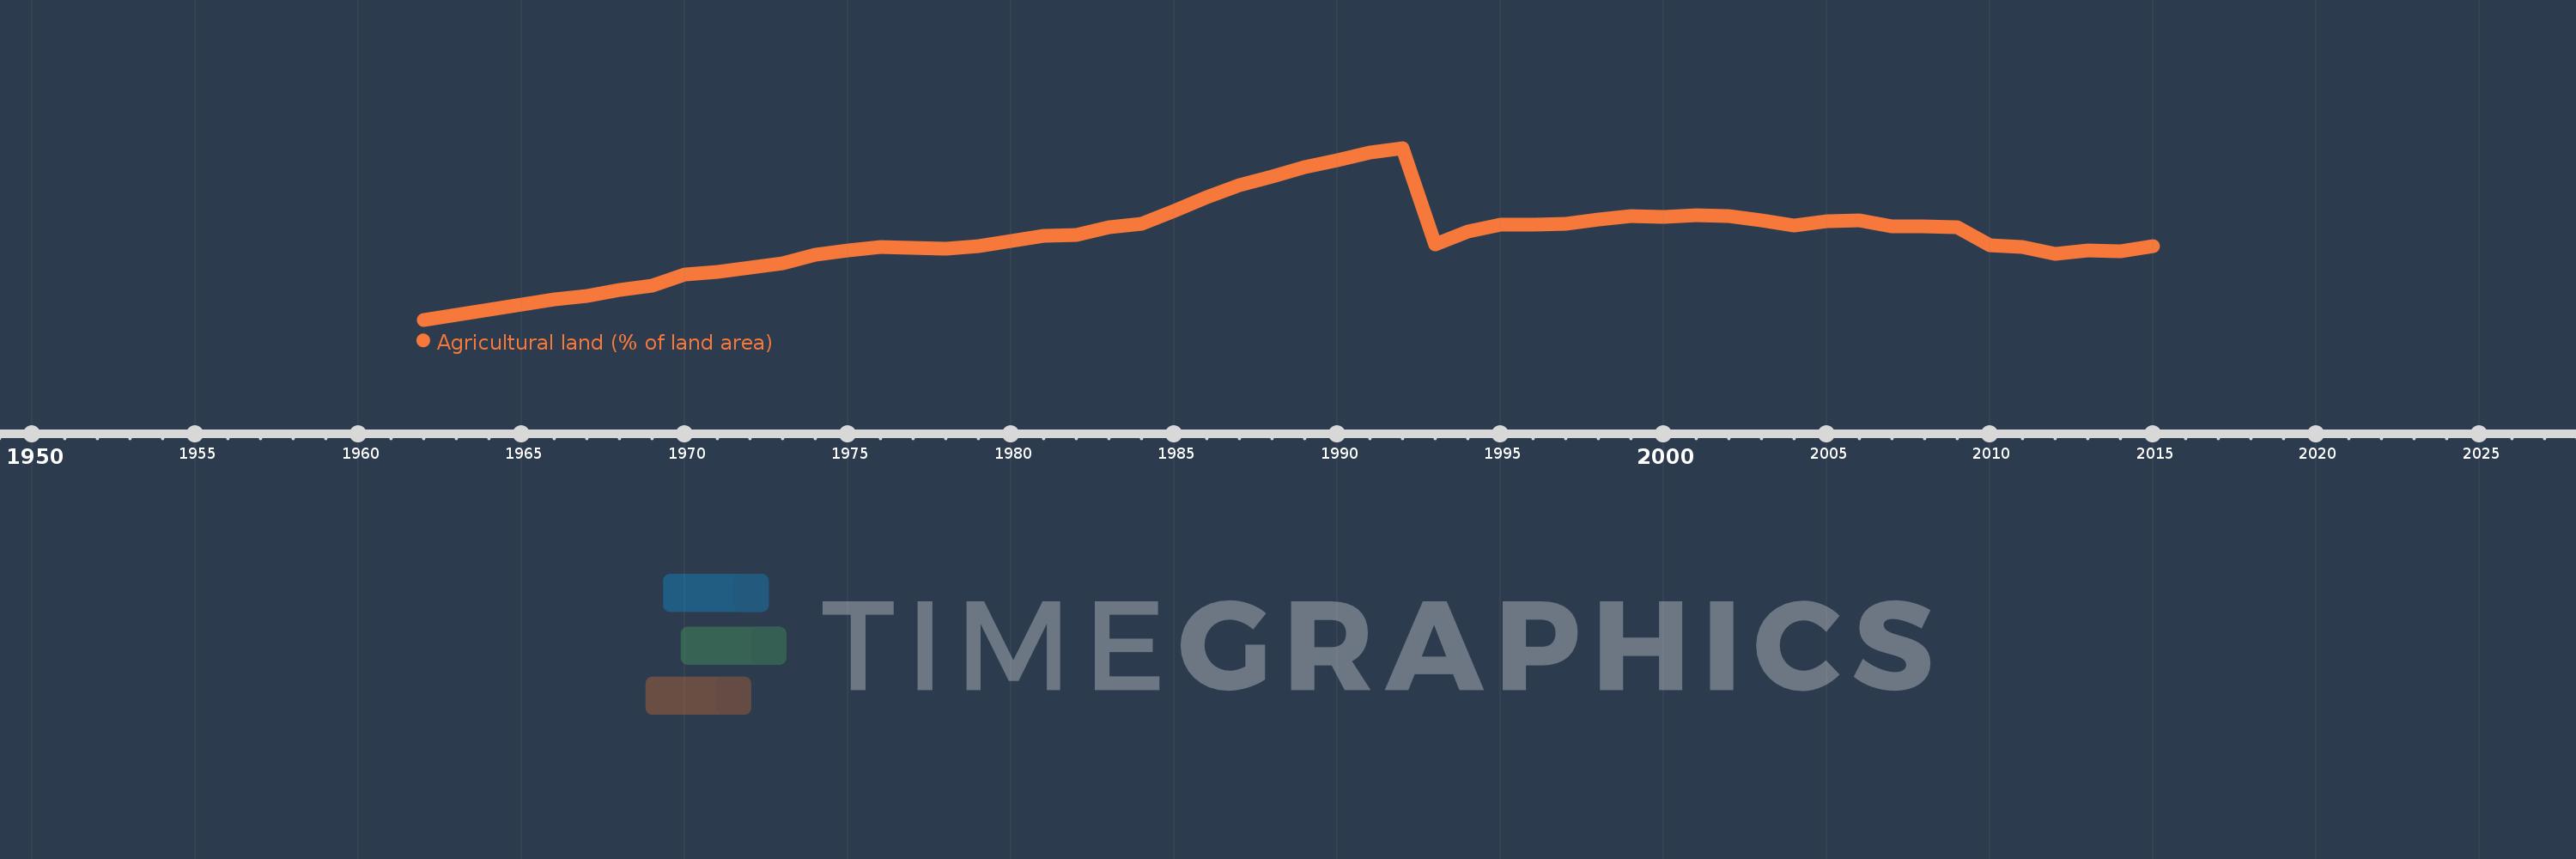
Agricultural land (% of land area)
2015,2014,2013,2012,2011,2010,2009,2008,2007,2006,2005,2004,2003,2002,2001,2000,1999,1998,1997,1996,1995,1994,1993,1992,1991,1990,1989,1988,1987,1986,1985,1984,1983,1982,1981,1980,1979,1978,1977,1976,1975,1974,1973,1972,1971,1970,1969,1968,1967,1966,1965,1964,1963,1962
This statistics in other country:
AfghanistanAlbaniaAlgeriaAmerican SamoaAndorraAngolaAntigua and BarbudaArab WorldArgentinaArmeniaArubaAustraliaAustriaAzerbaijanBahamas, TheBahrainBangladeshBarbadosBelarusBelgiumBelizeBeninBermudaBhutanBoliviaBosnia and HerzegovinaBotswanaBrazilBritish Virgin IslandsBrunei DarussalamBulgariaBurkina FasoBurundiCabo VerdeCambodiaCameroonCanadaCaribbean small statesCayman IslandsCentral African RepublicCentral Europe and the BalticsChadChannel IslandsChileChinaColombiaComorosCongo, Dem. Rep.Congo, Rep.Costa RicaCote d'IvoireCroatiaCubaCyprusCzech RepublicDenmarkDjiboutiDominicaDominican RepublicEarly-demographic dividendEast Asia & PacificEast Asia & Pacific (excluding high income)East Asia & Pacific (IDA & IBRD countries)EcuadorEgypt, Arab Rep.El SalvadorEquatorial GuineaEritreaEstoniaEthiopiaEuro areaEurope & Central AsiaEurope & Central Asia (excluding high income)Europe & Central Asia (IDA & IBRD countries)European UnionFaroe IslandsFijiFinlandFragile and conflict affected situationsFranceFrench PolynesiaGabonGambia, TheGeorgiaGermanyGhanaGreeceGreenlandGrenadaGuamGuatemalaGuineaGuinea-BissauGuyanaHaitiHeavily indebted poor countries (HIPC)High incomeHondurasHong Kong SAR, ChinaHungaryIBRD onlyIcelandIDA & IBRD totalIDA blendIDA onlyIDA totalIndiaIndonesiaIran, Islamic Rep.IraqIrelandIsle of ManIsraelItalyJamaicaJapanJordanKazakhstanKenyaKiribatiKorea, Dem. People’s Rep.Korea, Rep.KosovoKuwaitKyrgyz RepublicLao PDRLate-demographic dividendLatin America & Caribbean Latin America & Caribbean (excluding high income)Latin America & the Caribbean (IDA & IBRD countries)LatviaLeast developed countries: UN classificationLebanonLesothoLiberiaLibyaLiechtensteinLithuaniaLow & middle incomeLow incomeLower middle incomeLuxembourgMacedonia, FYRMadagascarMalawiMalaysiaMaldivesMaliMaltaMarshall IslandsMauritaniaMauritiusMexicoMicronesia, Fed. Sts.Middle East & North AfricaMiddle East & North Africa (excluding high income)Middle East & North Africa (IDA & IBRD countries)Middle incomeMoldovaMongoliaMontenegroMoroccoMozambiqueMyanmarNamibiaNauruNepalNetherlandsNew CaledoniaNew ZealandNicaraguaNigerNigeriaNorth AmericaNorthern Mariana IslandsNorwayOECD membersOmanOther small statesPacific island small statesPakistanPalauPanamaPapua New GuineaParaguayPeruPhilippinesPolandPortugalPost-demographic dividendPre-demographic dividendPuerto RicoQatarRomaniaRussian FederationRwandaSamoaSan MarinoSao Tome and PrincipeSaudi ArabiaSenegalSerbiaSeychellesSierra LeoneSingaporeSlovak RepublicSloveniaSmall statesSolomon IslandsSomaliaSouth AfricaSouth AsiaSouth Asia (IDA & IBRD)SpainSri LankaSt. Kitts and NevisSt. LuciaSt. Vincent and the GrenadinesSub-Saharan Africa Sub-Saharan Africa (excluding high income)Sub-Saharan Africa (IDA & IBRD countries)SudanSurinameSwazilandSwedenSwitzerlandSyrian Arab RepublicTajikistanTanzaniaThailandTimor-LesteTogoTongaTrinidad and TobagoTunisiaTurkeyTurkmenistanTurks and Caicos IslandsTuvaluUgandaUkraineUnited Arab EmiratesUnited KingdomUnited StatesUpper middle incomeUruguayUzbekistanVanuatuVenezuela, RBVietnamVirgin Islands (U.S.)West Bank and GazaWorldYemen, Rep.ZambiaZimbabwe Timeline:
This timeline shows a graph from 1962 to 2015 of World. No data until 1961. Number of actual observations by date: 54.
Source name:
World Development Indicators
Source organization:
Food and Agriculture Organization, electronic files and web site.
Categories, topics:
Agriculture & Rural Development, Climate Change, Environment
Last updated:
apr 23, 2017
Indicators value changes by year
Minimum:
36.028
jan 1, 1962
At the date of observation
Value
Absolute change
Change from previous value
jan 1, 1962
36.028
+36.028
0.0%
jan 1, 1963
36.119
+0.091
0.25%
jan 1, 1964
36.235
+0.116
0.32%
jan 1, 1965
36.329
+0.093
0.26%
jan 1, 1966
36.443
+0.115
0.32%
jan 1, 1967
36.512
+0.069
0.19%
jan 1, 1968
36.631
+0.119
0.32%
jan 1, 1969
36.718
+0.087
0.24%
jan 1, 1970
36.933
+0.215
0.59%
jan 1, 1971
36.979
+0.046
0.13%
jan 1, 1972
37.079
+0.1
0.27%
jan 1, 1973
37.166
+0.086
0.23%
jan 1, 1974
37.339
+0.173
0.47%
jan 1, 1975
37.41
+0.071
0.19%
jan 1, 1976
37.489
+0.08
0.21%
jan 1, 1977
37.467
-0.022
-0.06%
jan 1, 1978
37.449
-0.018
-0.05%
jan 1, 1979
37.498
+0.048
0.13%
jan 1, 1980
37.605
+0.108
0.29%
jan 1, 1981
37.713
+0.108
0.29%
jan 1, 1982
37.726
+0.013
0.03%
jan 1, 1983
37.876
+0.15
0.4%
jan 1, 1984
37.943
+0.067
0.18%
jan 1, 1985
38.212
+0.269
0.71%
jan 1, 1986
38.491
+0.279
0.73%
jan 1, 1987
38.725
+0.234
0.61%
jan 1, 1988
38.899
+0.174
0.45%
jan 1, 1989
39.084
+0.185
0.48%
jan 1, 1990
39.22
+0.136
0.35%
jan 1, 1991
39.374
+0.154
0.39%
jan 1, 1992
39.47
+0.096
0.24%
jan 1, 1993
37.545
-1.925
-4.88%
jan 1, 1994
37.799
+0.254
0.68%
jan 1, 1995
37.926
+0.127
0.34%
jan 1, 1996
37.927
+0.001
0.0%
jan 1, 1997
37.958
+0.031
0.08%
jan 1, 1998
38.044
+0.086
0.23%
jan 1, 1999
38.105
+0.061
0.16%
jan 1, 2000
38.08
-0.024
-0.06%
jan 1, 2001
38.122
+0.042
0.11%
jan 1, 2002
38.106
-0.016
-0.04%
jan 1, 2003
38.016
-0.09
-0.24%
jan 1, 2004
37.921
-0.095
-0.25%
jan 1, 2005
38.004
+0.083
0.22%
jan 1, 2006
38.015
+0.011
0.03%
jan 1, 2007
37.907
-0.108
-0.28%
jan 1, 2008
37.896
-0.011
-0.03%
jan 1, 2009
37.877
-0.019
-0.05%
jan 1, 2010
37.517
-0.36
-0.95%
jan 1, 2011
37.487
-0.03
-0.08%
jan 1, 2012
37.35
-0.137
-0.37%
jan 1, 2013
37.424
+0.074
0.2%
jan 1, 2014
37.398
-0.026
-0.07%
jan 1, 2015
37.505
+0.107
0.29%
Ranking of countries by current statistics by years


Comments: