29
/
en
AIzaSyAYiBZKx7MnpbEhh9jyipgxe19OcubqV5w
April 1, 2024
177311
Lesotho
LSO
true
2
1
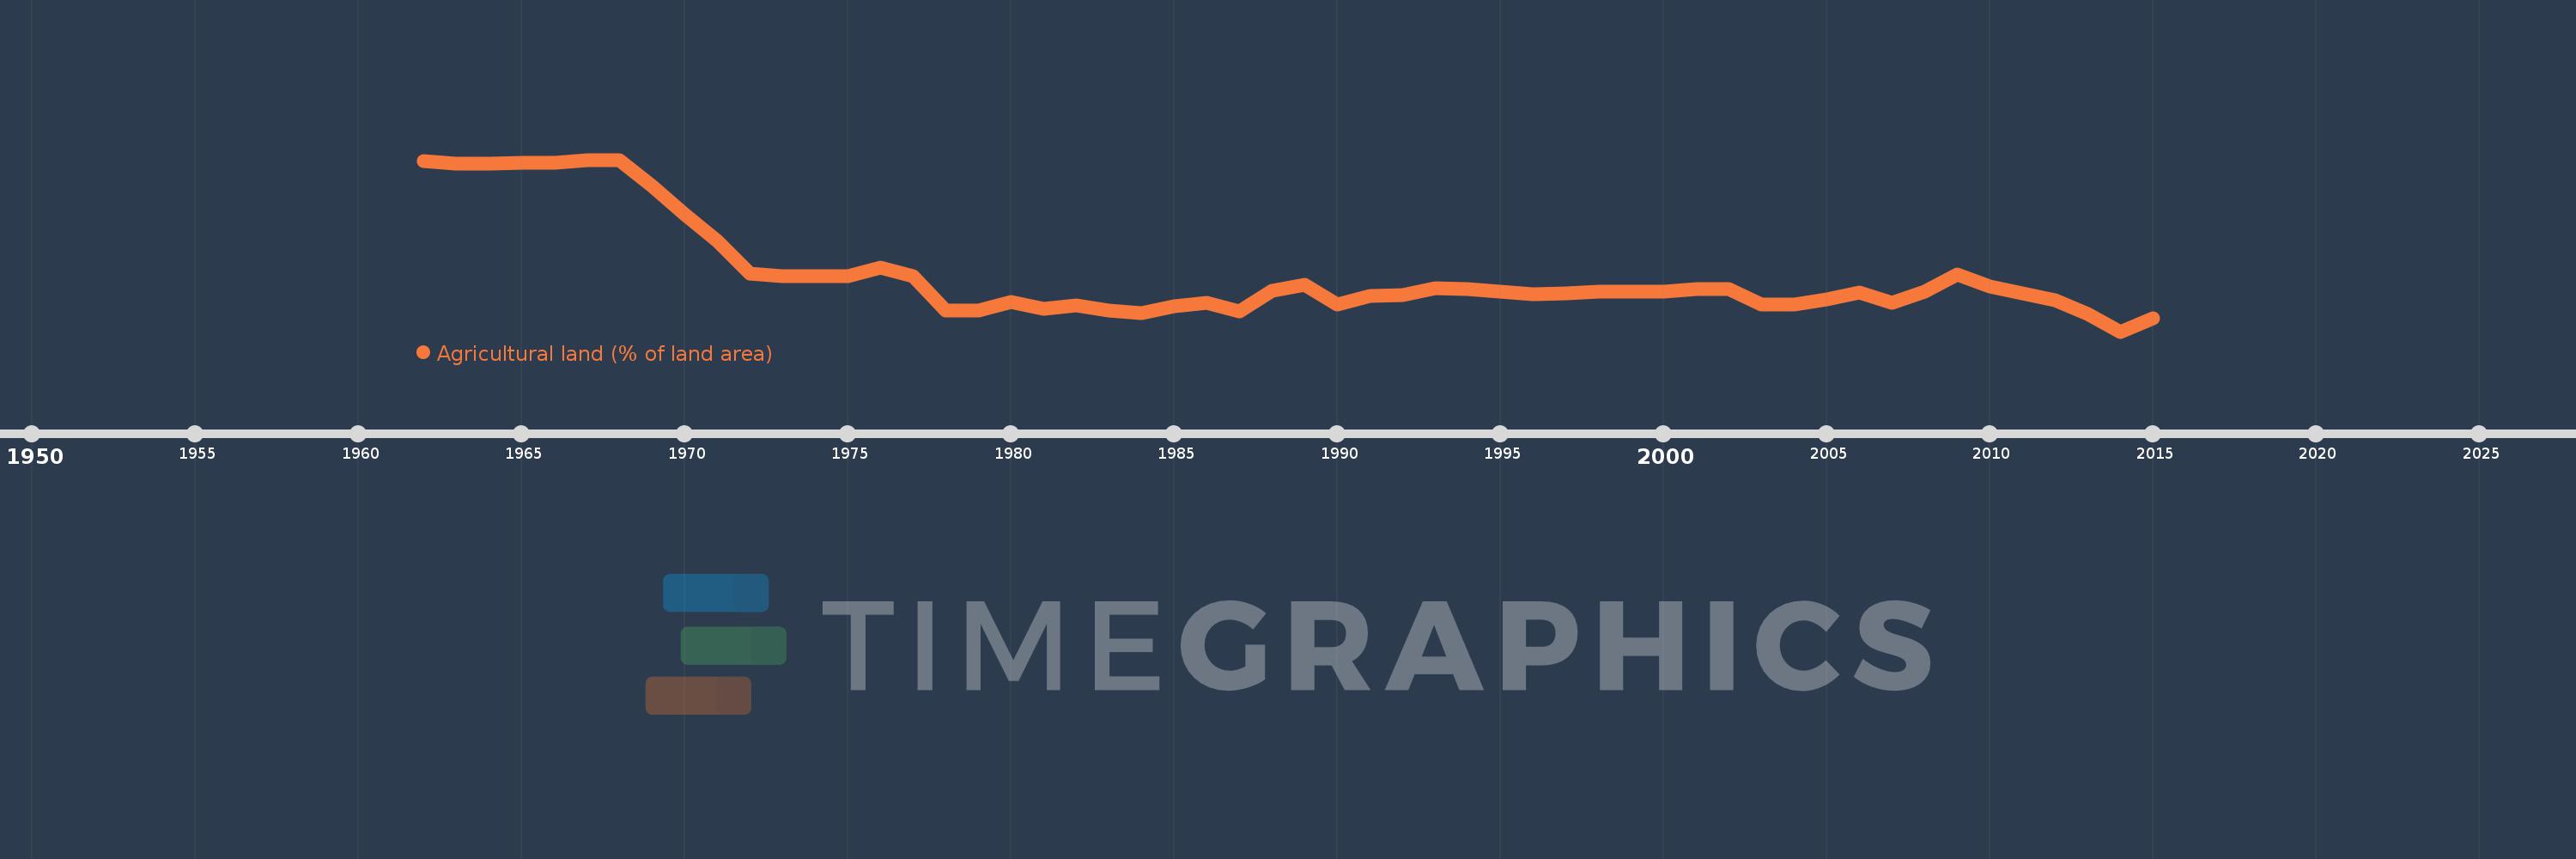
Agricultural land (% of land area)
2015,2014,2013,2012,2011,2010,2009,2008,2007,2006,2005,2004,2003,2002,2001,2000,1999,1998,1997,1996,1995,1994,1993,1992,1991,1990,1989,1988,1987,1986,1985,1984,1983,1982,1981,1980,1979,1978,1977,1976,1975,1974,1973,1972,1971,1970,1969,1968,1967,1966,1965,1964,1963,1962
This statistics in other country:
AfghanistanAlbaniaAlgeriaAmerican SamoaAndorraAngolaAntigua and BarbudaArab WorldArgentinaArmeniaArubaAustraliaAustriaAzerbaijanBahamas, TheBahrainBangladeshBarbadosBelarusBelgiumBelizeBeninBermudaBhutanBoliviaBosnia and HerzegovinaBotswanaBrazilBritish Virgin IslandsBrunei DarussalamBulgariaBurkina FasoBurundiCabo VerdeCambodiaCameroonCanadaCaribbean small statesCayman IslandsCentral African RepublicCentral Europe and the BalticsChadChannel IslandsChileChinaColombiaComorosCongo, Dem. Rep.Congo, Rep.Costa RicaCote d'IvoireCroatiaCubaCyprusCzech RepublicDenmarkDjiboutiDominicaDominican RepublicEarly-demographic dividendEast Asia & PacificEast Asia & Pacific (excluding high income)East Asia & Pacific (IDA & IBRD countries)EcuadorEgypt, Arab Rep.El SalvadorEquatorial GuineaEritreaEstoniaEthiopiaEuro areaEurope & Central AsiaEurope & Central Asia (excluding high income)Europe & Central Asia (IDA & IBRD countries)European UnionFaroe IslandsFijiFinlandFragile and conflict affected situationsFranceFrench PolynesiaGabonGambia, TheGeorgiaGermanyGhanaGreeceGreenlandGrenadaGuamGuatemalaGuineaGuinea-BissauGuyanaHaitiHeavily indebted poor countries (HIPC)High incomeHondurasHong Kong SAR, ChinaHungaryIBRD onlyIcelandIDA & IBRD totalIDA blendIDA onlyIDA totalIndiaIndonesiaIran, Islamic Rep.IraqIrelandIsle of ManIsraelItalyJamaicaJapanJordanKazakhstanKenyaKiribatiKorea, Dem. People’s Rep.Korea, Rep.KosovoKuwaitKyrgyz RepublicLao PDRLate-demographic dividendLatin America & Caribbean Latin America & Caribbean (excluding high income)Latin America & the Caribbean (IDA & IBRD countries)LatviaLeast developed countries: UN classificationLebanonLesothoLiberiaLibyaLiechtensteinLithuaniaLow & middle incomeLow incomeLower middle incomeLuxembourgMacedonia, FYRMadagascarMalawiMalaysiaMaldivesMaliMaltaMarshall IslandsMauritaniaMauritiusMexicoMicronesia, Fed. Sts.Middle East & North AfricaMiddle East & North Africa (excluding high income)Middle East & North Africa (IDA & IBRD countries)Middle incomeMoldovaMongoliaMontenegroMoroccoMozambiqueMyanmarNamibiaNauruNepalNetherlandsNew CaledoniaNew ZealandNicaraguaNigerNigeriaNorth AmericaNorthern Mariana IslandsNorwayOECD membersOmanOther small statesPacific island small statesPakistanPalauPanamaPapua New GuineaParaguayPeruPhilippinesPolandPortugalPost-demographic dividendPre-demographic dividendPuerto RicoQatarRomaniaRussian FederationRwandaSamoaSan MarinoSao Tome and PrincipeSaudi ArabiaSenegalSerbiaSeychellesSierra LeoneSingaporeSlovak RepublicSloveniaSmall statesSolomon IslandsSomaliaSouth AfricaSouth AsiaSouth Asia (IDA & IBRD)SpainSri LankaSt. Kitts and NevisSt. LuciaSt. Vincent and the GrenadinesSub-Saharan Africa Sub-Saharan Africa (excluding high income)Sub-Saharan Africa (IDA & IBRD countries)SudanSurinameSwazilandSwedenSwitzerlandSyrian Arab RepublicTajikistanTanzaniaThailandTimor-LesteTogoTongaTrinidad and TobagoTunisiaTurkeyTurkmenistanTurks and Caicos IslandsTuvaluUgandaUkraineUnited Arab EmiratesUnited KingdomUnited StatesUpper middle incomeUruguayUzbekistanVanuatuVenezuela, RBVietnamVirgin Islands (U.S.)West Bank and GazaWorldYemen, Rep.ZambiaZimbabwe Timeline:
This timeline shows a graph from 1962 to 2015 of Lesotho. No data until 1961. Number of actual observations by date: 54.
Source name:
World Development Indicators
Source organization:
Food and Agriculture Organization, electronic files and web site.
Categories, topics:
Agriculture & Rural Development, Climate Change, Environment
Last updated:
apr 23, 2017
Indicators value changes by year
Maximum:
85.079
jan 1, 1967
At the date of observation
Value
Absolute change
Change from previous value
jan 1, 1962
85.013
+85.013
0.0%
jan 1, 1963
84.848
-0.165
-0.19%
jan 1, 1964
84.848
0.0
0.0%
jan 1, 1965
84.914
+0.066
0.08%
jan 1, 1966
84.914
0.0
0.0%
jan 1, 1967
85.079
+0.165
0.19%
jan 1, 1968
85.079
0.0
0.0%
jan 1, 1969
83.432
-1.647
-1.94%
jan 1, 1970
81.621
-1.812
-2.17%
jan 1, 1971
79.941
-1.68
-2.06%
jan 1, 1972
77.866
-2.075
-2.6%
jan 1, 1973
77.701
-0.165
-0.21%
jan 1, 1974
77.701
0.0
0.0%
jan 1, 1975
77.701
0.0
0.0%
jan 1, 1976
78.261
+0.56
0.72%
jan 1, 1977
77.701
-0.56
-0.72%
jan 1, 1978
75.494
-2.207
-2.84%
jan 1, 1979
75.527
+0.033
0.04%
jan 1, 1980
76.054
+0.527
0.7%
jan 1, 1981
75.626
-0.428
-0.56%
jan 1, 1982
75.823
+0.198
0.26%
jan 1, 1983
75.494
-0.329
-0.43%
jan 1, 1984
75.329
-0.165
-0.22%
jan 1, 1985
75.791
+0.461
0.61%
jan 1, 1986
76.021
+0.231
0.3%
jan 1, 1987
75.461
-0.56
-0.74%
jan 1, 1988
76.746
+1.285
1.7%
jan 1, 1989
77.174
+0.428
0.56%
jan 1, 1990
75.922
-1.252
-1.62%
jan 1, 1991
76.449
+0.527
0.69%
jan 1, 1992
76.515
+0.066
0.09%
jan 1, 1993
76.943
+0.428
0.56%
jan 1, 1994
76.877
-0.066
-0.09%
jan 1, 1995
76.713
-0.165
-0.21%
jan 1, 1996
76.548
-0.165
-0.21%
jan 1, 1997
76.614
+0.066
0.09%
jan 1, 1998
76.713
+0.099
0.13%
jan 1, 1999
76.713
0.0
0.0%
jan 1, 2000
76.713
0.0
0.0%
jan 1, 2001
76.877
+0.165
0.21%
jan 1, 2002
76.877
0.0
0.0%
jan 1, 2003
75.889
-0.988
-1.29%
jan 1, 2004
75.889
0.0
0.0%
jan 1, 2005
76.219
+0.329
0.43%
jan 1, 2006
76.647
+0.428
0.56%
jan 1, 2007
75.988
-0.659
-0.86%
jan 1, 2008
76.713
+0.725
0.95%
jan 1, 2009
77.8
+1.087
1.42%
jan 1, 2010
77.042
-0.758
-0.97%
jan 1, 2011
76.614
-0.428
-0.56%
jan 1, 2012
76.153
-0.461
-0.6%
jan 1, 2013
75.273
-0.879
-1.15%
jan 1, 2014
74.18
-1.094
-1.45%
jan 1, 2015
75.01
+0.83
1.12%
Ranking of countries by current statistics by years


Comments: