29
/
en
AIzaSyAYiBZKx7MnpbEhh9jyipgxe19OcubqV5w
April 1, 2024
281891
Vietnam
VNM
true
2
1
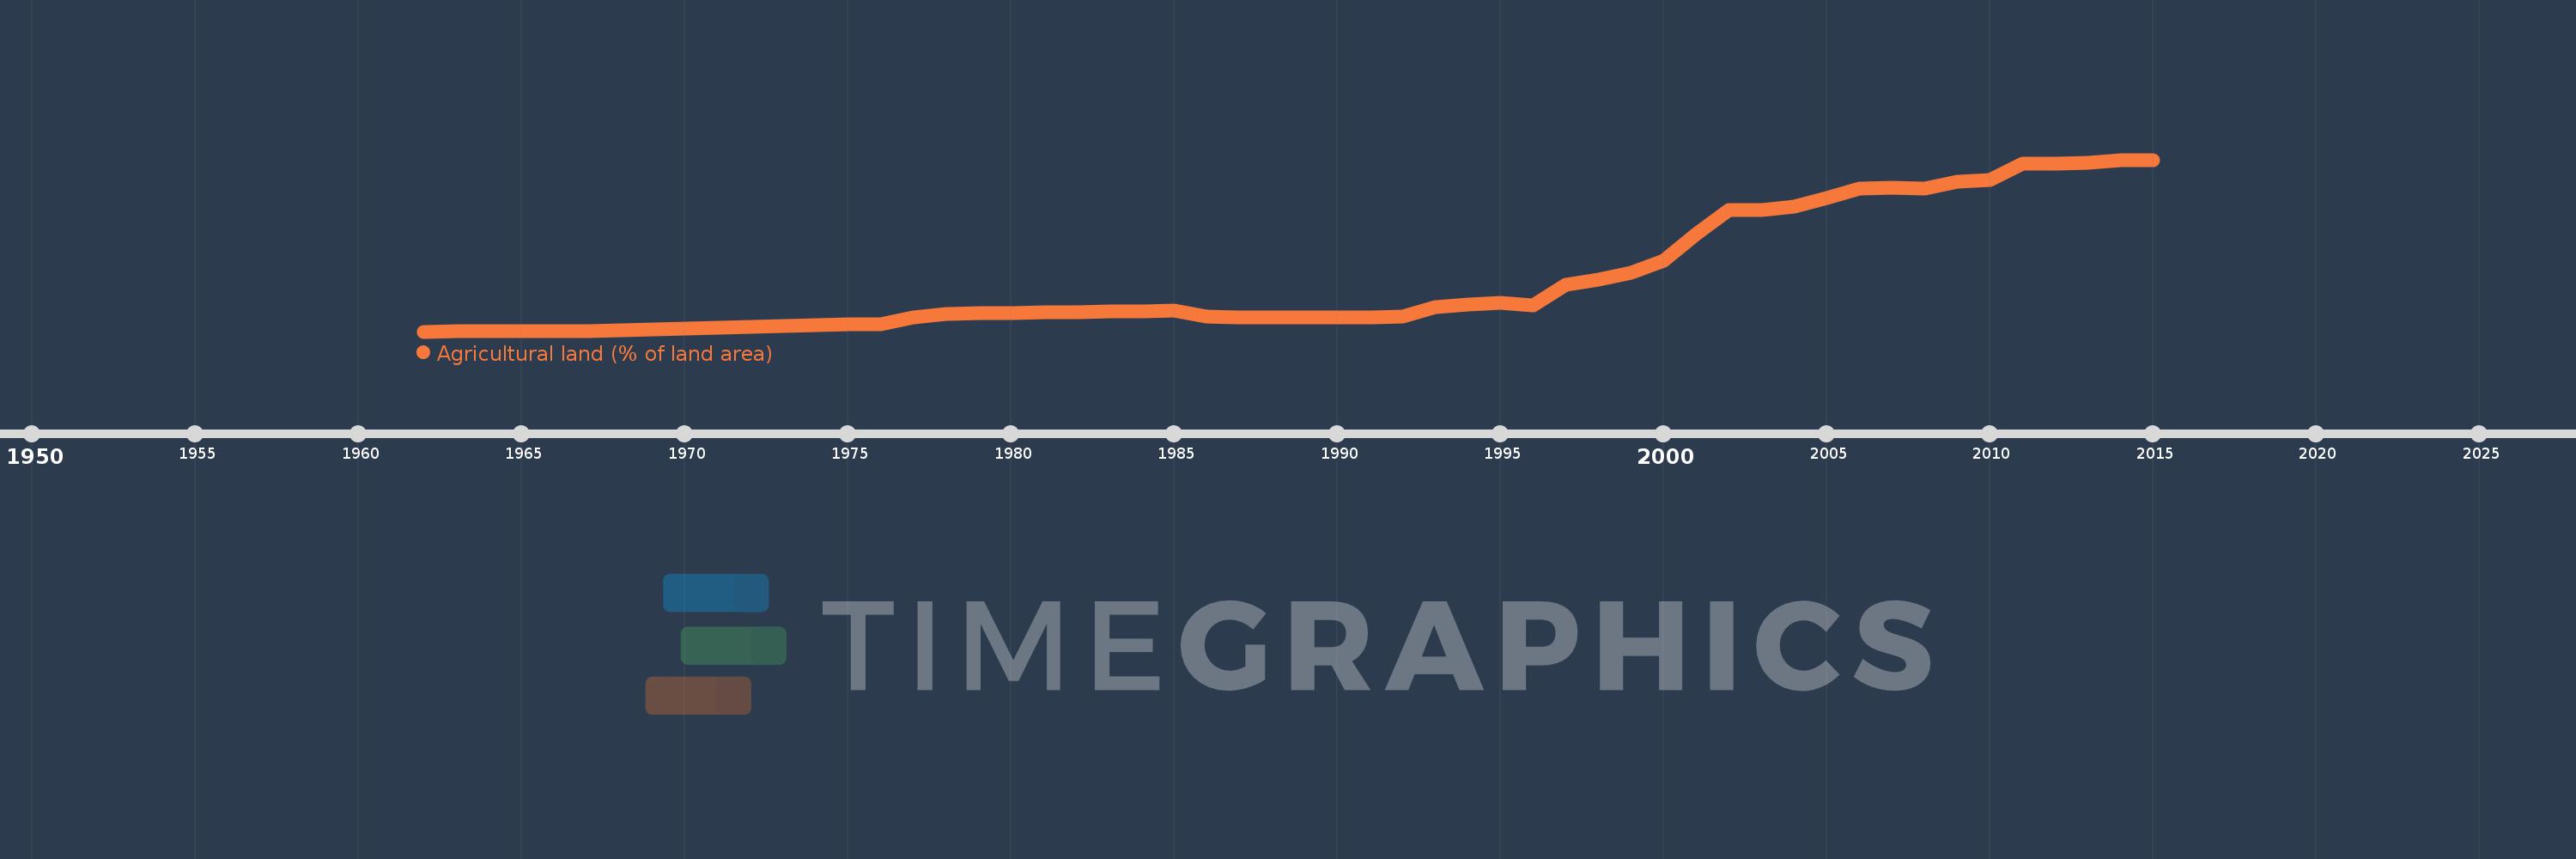
Agricultural land (% of land area)
2015,2014,2013,2012,2011,2010,2009,2008,2007,2006,2005,2004,2003,2002,2001,2000,1999,1998,1997,1996,1995,1994,1993,1992,1991,1990,1989,1988,1987,1986,1985,1984,1983,1982,1981,1980,1979,1978,1977,1976,1975,1974,1973,1972,1971,1970,1969,1968,1967,1966,1965,1964,1963,1962
This statistics in other country:
AfghanistanAlbaniaAlgeriaAmerican SamoaAndorraAngolaAntigua and BarbudaArab WorldArgentinaArmeniaArubaAustraliaAustriaAzerbaijanBahamas, TheBahrainBangladeshBarbadosBelarusBelgiumBelizeBeninBermudaBhutanBoliviaBosnia and HerzegovinaBotswanaBrazilBritish Virgin IslandsBrunei DarussalamBulgariaBurkina FasoBurundiCabo VerdeCambodiaCameroonCanadaCaribbean small statesCayman IslandsCentral African RepublicCentral Europe and the BalticsChadChannel IslandsChileChinaColombiaComorosCongo, Dem. Rep.Congo, Rep.Costa RicaCote d'IvoireCroatiaCubaCyprusCzech RepublicDenmarkDjiboutiDominicaDominican RepublicEarly-demographic dividendEast Asia & PacificEast Asia & Pacific (excluding high income)East Asia & Pacific (IDA & IBRD countries)EcuadorEgypt, Arab Rep.El SalvadorEquatorial GuineaEritreaEstoniaEthiopiaEuro areaEurope & Central AsiaEurope & Central Asia (excluding high income)Europe & Central Asia (IDA & IBRD countries)European UnionFaroe IslandsFijiFinlandFragile and conflict affected situationsFranceFrench PolynesiaGabonGambia, TheGeorgiaGermanyGhanaGreeceGreenlandGrenadaGuamGuatemalaGuineaGuinea-BissauGuyanaHaitiHeavily indebted poor countries (HIPC)High incomeHondurasHong Kong SAR, ChinaHungaryIBRD onlyIcelandIDA & IBRD totalIDA blendIDA onlyIDA totalIndiaIndonesiaIran, Islamic Rep.IraqIrelandIsle of ManIsraelItalyJamaicaJapanJordanKazakhstanKenyaKiribatiKorea, Dem. People’s Rep.Korea, Rep.KosovoKuwaitKyrgyz RepublicLao PDRLate-demographic dividendLatin America & Caribbean Latin America & Caribbean (excluding high income)Latin America & the Caribbean (IDA & IBRD countries)LatviaLeast developed countries: UN classificationLebanonLesothoLiberiaLibyaLiechtensteinLithuaniaLow & middle incomeLow incomeLower middle incomeLuxembourgMacedonia, FYRMadagascarMalawiMalaysiaMaldivesMaliMaltaMarshall IslandsMauritaniaMauritiusMexicoMicronesia, Fed. Sts.Middle East & North AfricaMiddle East & North Africa (excluding high income)Middle East & North Africa (IDA & IBRD countries)Middle incomeMoldovaMongoliaMontenegroMoroccoMozambiqueMyanmarNamibiaNauruNepalNetherlandsNew CaledoniaNew ZealandNicaraguaNigerNigeriaNorth AmericaNorthern Mariana IslandsNorwayOECD membersOmanOther small statesPacific island small statesPakistanPalauPanamaPapua New GuineaParaguayPeruPhilippinesPolandPortugalPost-demographic dividendPre-demographic dividendPuerto RicoQatarRomaniaRussian FederationRwandaSamoaSan MarinoSao Tome and PrincipeSaudi ArabiaSenegalSerbiaSeychellesSierra LeoneSingaporeSlovak RepublicSloveniaSmall statesSolomon IslandsSomaliaSouth AfricaSouth AsiaSouth Asia (IDA & IBRD)SpainSri LankaSt. Kitts and NevisSt. LuciaSt. Vincent and the GrenadinesSub-Saharan Africa Sub-Saharan Africa (excluding high income)Sub-Saharan Africa (IDA & IBRD countries)SudanSurinameSwazilandSwedenSwitzerlandSyrian Arab RepublicTajikistanTanzaniaThailandTimor-LesteTogoTongaTrinidad and TobagoTunisiaTurkeyTurkmenistanTurks and Caicos IslandsTuvaluUgandaUkraineUnited Arab EmiratesUnited KingdomUnited StatesUpper middle incomeUruguayUzbekistanVanuatuVenezuela, RBVietnamVirgin Islands (U.S.)West Bank and GazaWorldYemen, Rep.ZambiaZimbabwe Timeline:
This timeline shows a graph from 1962 to 2015 of Vietnam. No data until 1961. Number of actual observations by date: 54.
Source name:
World Development Indicators
Source organization:
Food and Agriculture Organization, electronic files and web site.
Categories, topics:
Agriculture & Rural Development, Climate Change, Environment
Last updated:
apr 23, 2017
Indicators value changes by year
Minimum:
19.331
jan 1, 1962
Maximum:
35.069
jan 1, 2015
At the date of observation
Value
Absolute change
Change from previous value
jan 1, 1962
19.331
+19.331
0.0%
jan 1, 1963
19.346
+0.015
0.08%
jan 1, 1964
19.362
+0.015
0.08%
jan 1, 1965
19.377
+0.015
0.08%
jan 1, 1966
19.392
+0.015
0.08%
jan 1, 1967
19.408
+0.015
0.08%
jan 1, 1968
19.484
+0.077
0.4%
jan 1, 1969
19.561
+0.077
0.39%
jan 1, 1970
19.607
+0.046
0.24%
jan 1, 1971
19.715
+0.108
0.55%
jan 1, 1972
19.73
+0.015
0.08%
jan 1, 1973
19.807
+0.077
0.39%
jan 1, 1974
19.915
+0.108
0.54%
jan 1, 1975
19.991
+0.077
0.39%
jan 1, 1976
20.007
+0.015
0.08%
jan 1, 1977
20.652
+0.645
3.22%
jan 1, 1978
20.928
+0.277
1.34%
jan 1, 1979
21.002
+0.074
0.35%
jan 1, 1980
21.045
+0.043
0.2%
jan 1, 1981
21.07
+0.025
0.12%
jan 1, 1982
21.125
+0.055
0.26%
jan 1, 1983
21.15
+0.025
0.12%
jan 1, 1984
21.205
+0.055
0.26%
jan 1, 1985
21.23
+0.025
0.12%
jan 1, 1986
20.738
-0.492
-2.32%
jan 1, 1987
20.661
-0.077
-0.37%
jan 1, 1988
20.615
-0.046
-0.22%
jan 1, 1989
20.615
0.0
0.0%
jan 1, 1990
20.63
+0.015
0.07%
jan 1, 1991
20.664
+0.034
0.16%
jan 1, 1992
20.741
+0.077
0.37%
jan 1, 1993
21.583
+0.842
4.06%
jan 1, 1994
21.773
+0.19
0.88%
jan 1, 1995
21.936
+0.163
0.75%
jan 1, 1996
21.749
-0.187
-0.85%
jan 1, 1997
23.601
+1.853
8.52%
jan 1, 1998
24.099
+0.498
2.11%
jan 1, 1999
24.747
+0.648
2.69%
jan 1, 2000
25.847
+1.1
4.44%
jan 1, 2001
28.226
+2.379
9.2%
jan 1, 2002
30.483
+2.257
8.0%
jan 1, 2003
30.446
-0.037
-0.12%
jan 1, 2004
30.758
+0.312
1.02%
jan 1, 2005
31.592
+0.834
2.71%
jan 1, 2006
32.425
+0.834
2.64%
jan 1, 2007
32.502
+0.077
0.24%
jan 1, 2008
32.453
-0.05
-0.15%
jan 1, 2009
33.027
+0.575
1.77%
jan 1, 2010
33.193
+0.165
0.5%
jan 1, 2011
34.702
+1.51
4.55%
jan 1, 2012
34.73
+0.027
0.08%
jan 1, 2013
34.809
+0.08
0.23%
jan 1, 2014
35.001
+0.192
0.55%
jan 1, 2015
35.069
+0.067
0.19%
Ranking of countries by current statistics by years


Comments: